Our brand new solo games combine with your quiz, on the same screen

Correct quiz answers unlock more play!

New Quizalize solo game modes
10 questions
Show answers
  • Q1

    Couples who share more similar attitudes indicate that they are more satisfied with their relationship. This reflects a ___________ correlation.

    No correlation

    Strong negative

    Strong Positive

    Weak Positive

    30s
  • Q2

    Correlation is _____type of statistical analysis.

    trivariate

    multivariate

    univariate

    bivariate

    30s
  • Q3

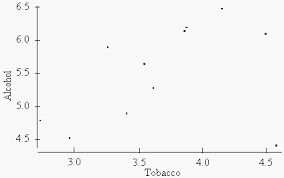
    The diagram shown is an example of a ____________. 

    Question Image

    histogram illustrating a lack of correlation between tobacco and alcohol

    scatter plot illustrating a positive correlation between tobacco and alcohol

    scatter plot illustrating a perfect correlation between tobacco and alcohol

    histogram illustrating a positive correlation between tobacco and alcohol

    60s
  • Q4

    What is the relationship of this statement: The temperature outside and the number of layers of clothes you need to stay warm.

    Negative correlation

    Weak Positive

    Positive correlation

    No correlation

    60s
  • Q5

    The measure of the linear correlation (dependence) between two variables X and Y, giving a value between +1 and −1 is called ______.

    Pearson a

    Pearson r

    Pearson s

    Pearson z

    60s
  • Q6

    The closer the value of r is to 1 or -1, the _____ is the linear relationship between the two variables.

    weaker

    direct

    stronger

    inverse

    60s
  • Q7

    The strength of linear relationship between x and y is very weak if the absolute value of correlation coefficient value is

    0-0.2

    0.6-0.8

    0.4-0.6 

    0.2-0.4 

    60s
  • Q8

    A plot of pairs of values of two variables in a rectangular coordinate plane displaying a relationship between the two variables.

    Outlier

    Graph 

    Pearson

    Scatter Diagram 

    60s
  • Q9

    Which scatterplot shows most likely a positive correlation?

    Question Image

    C only

    Both A and B

    A only

    B only

    60s
  • Q10

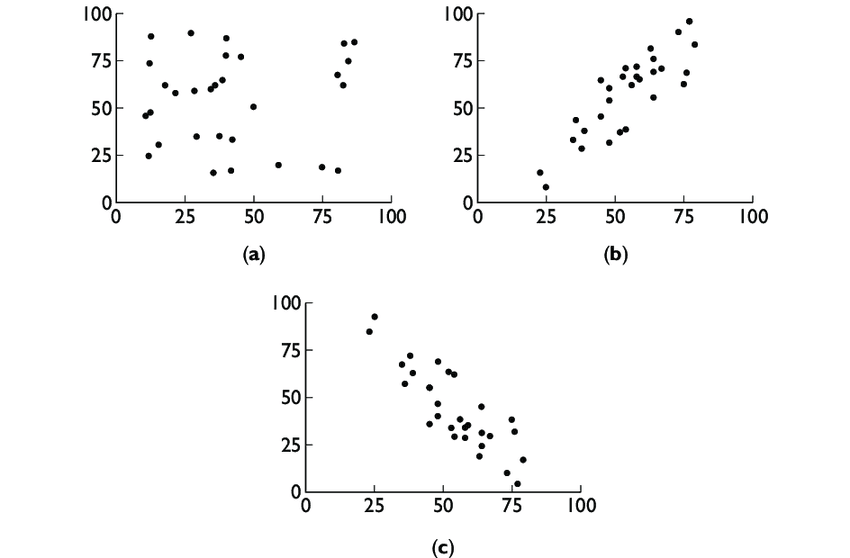
    In terms of strength of association, how do you compare scatterplot I with II?

    Question Image

    The strength of association in Scatterplot II is greater.

    The strength of association in Scatterplot I is greater.

    The strength of association in the scatterplots cannot be compared.

    The strength of association in both scatterplots II is the same.

    60s

Teachers give this quiz to your class