Reading Graphs Quiz
Quiz by Mallory Strelecky
Feel free to use or edit a copy
includes Teacher and Student dashboards
Measure skillsfrom any curriculum
Measure skills
from any curriculum
Tag the questions with any skills you have. Your dashboard will track each student's mastery of each skill.
With a free account, teachers can
- edit the questions
- save a copy for later
- start a class game
- automatically assign follow-up activities based on students’ scores
- assign as homework
- share a link with colleagues
- print as a bubble sheet
10 questions
Show answers
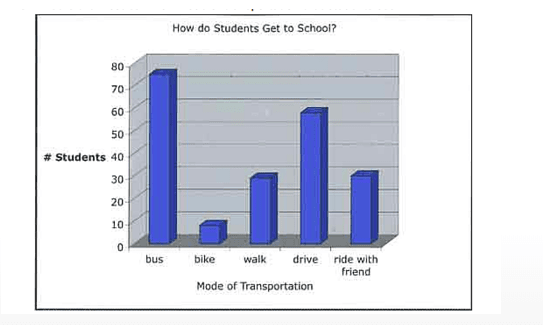
- Q1What is the most common mode of transportation that students use?bikedrivewalkbus300s
- Q2How many students take the bus to school?5556075300s
- Q3How many students drive to school?25556575300s
- Q4Do more students walk to school or ride with a friend?Many more students walk to school than ride with a friend.About the same number walk as ride with a friend.The graph does not provide this information.Many more students ride with a friend than walk.300s
- Q5In what month were gross sales at their highest point?January 2005April 2005August 2005October 2005300s
- Q6What was the change in gross sales from March 2005 to April 2005?The graph does not contain this information.Sales remained flat from March to April.Sales decreased greatly from March to April.Sales increased slightly from March to April.300s
- Q7Did gross sales from the vending machines increase or decrease from January 2005 to February 2005?Gross sales increased.Gross sales were flat.Gross sales decreased.The graph does not contain this information.300s
- Q8What percentage of the class is from Ecuador?9%The graph does not contain this information.15%12%300s
- Q9Which nationality makes up the smallest percentage of the class?SalvadoranMexicanBrazilianKorean300s
- Q10Are more students from Somalia or from El Salvador?They are the same.SomaliaEl SalvadorThe graph does not contain this information.300s
