Loading...
Reading Motion Graphs
Quiz by Marie Fogle
Customize this quiz to suit your class
Instantly translate to 100+ languages
Tag the questions with any skills you have. Your dashboard will track each student's mastery of each skill.
Give this quiz to my class
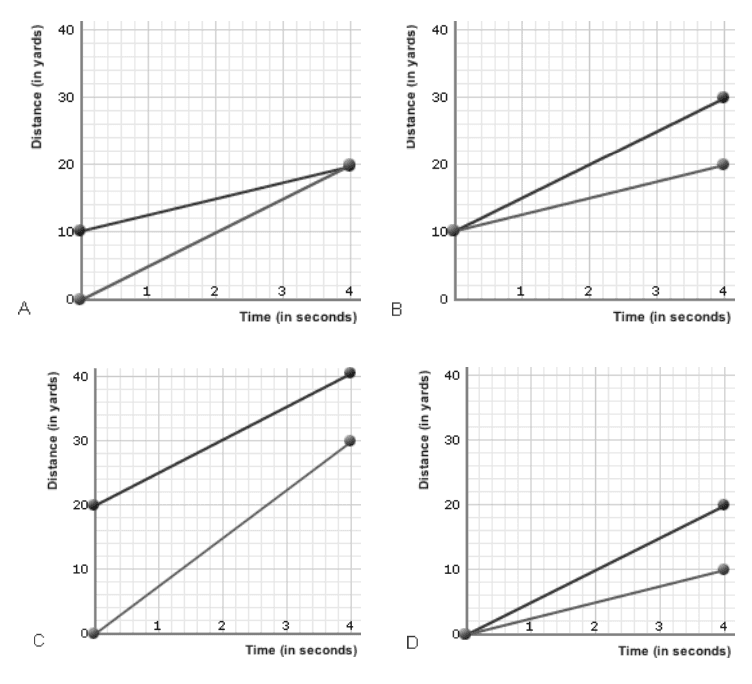
Which of the graphs shows that one of the runners started 10 yards further ahead of the other?
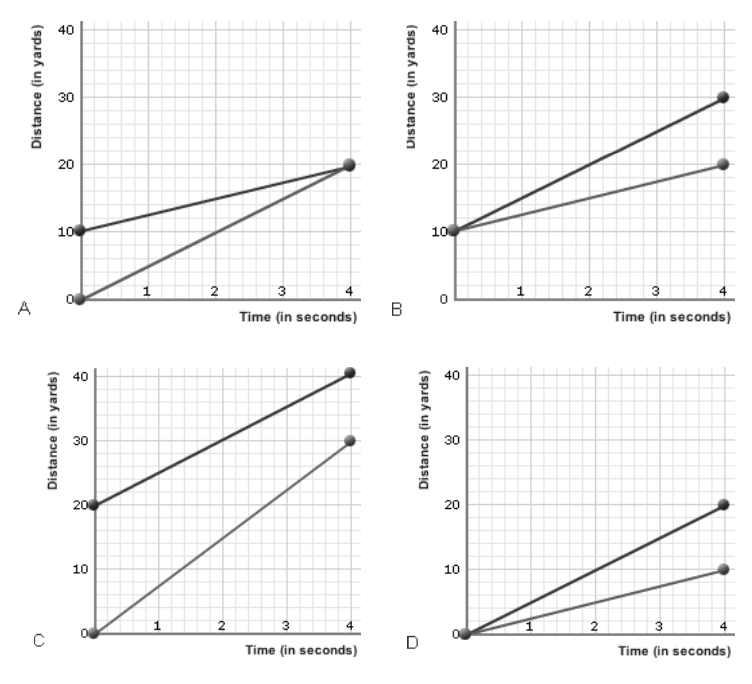
Graph C
Graph B
Graph A
Graph D
Which distance-time graph represents that the car is stopped
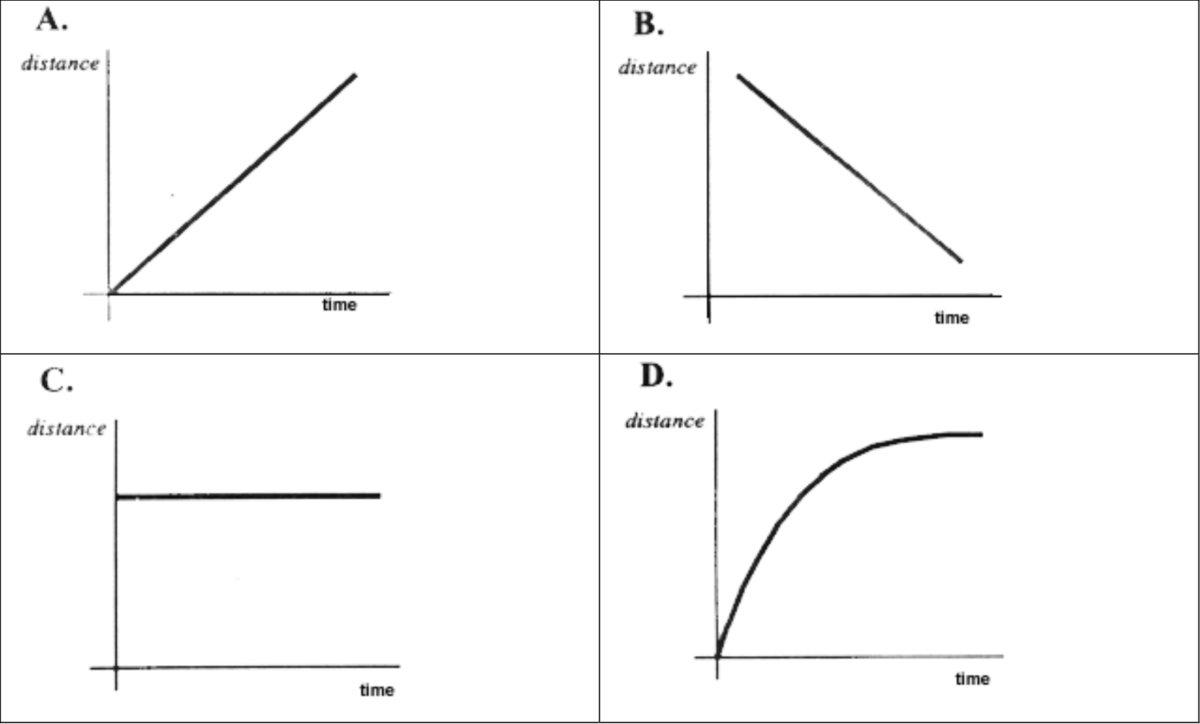
Graph B
Graph C
Graph D
Graph A
Which of the graphs shows that one of the runners started 10 yards further ahead of the other?
Which distance-time graph represents that the car is stopped

Which distance-time graph represents that the speed of the car is decreasing.
Which speed-time graph represents that the car is traveling at a constant speed..
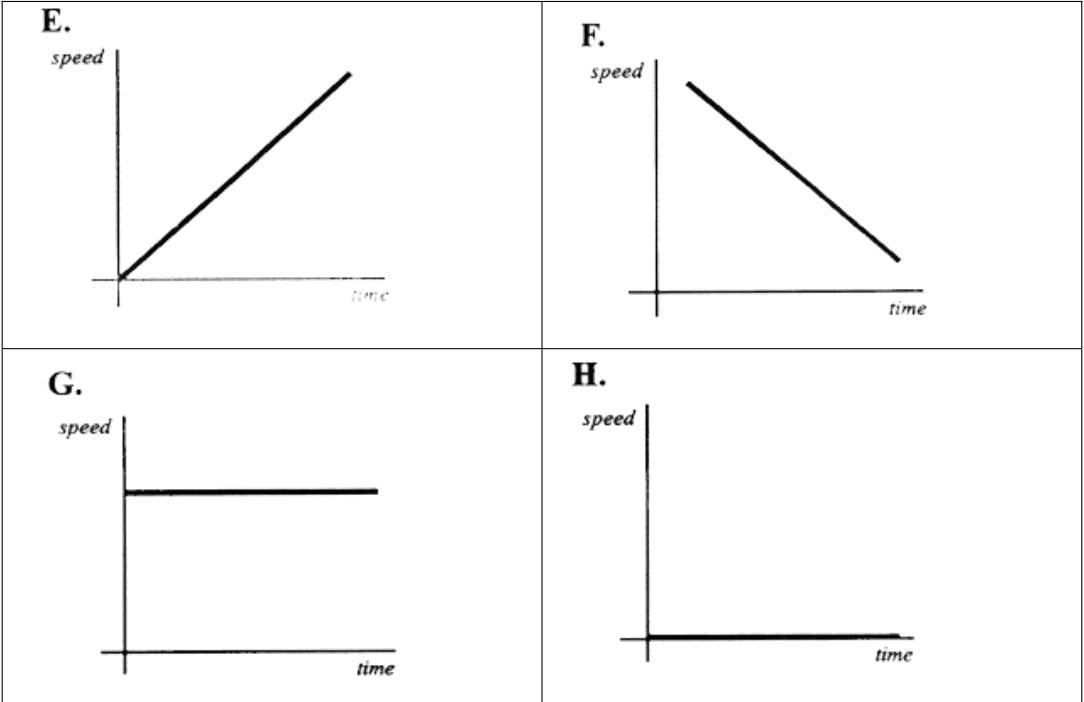
Which speed-time graph represents that the car is accelerating.
In Segment 0-A, the bus is ________________. Its speed changes from 0 to 10 m/s in 5 seconds.
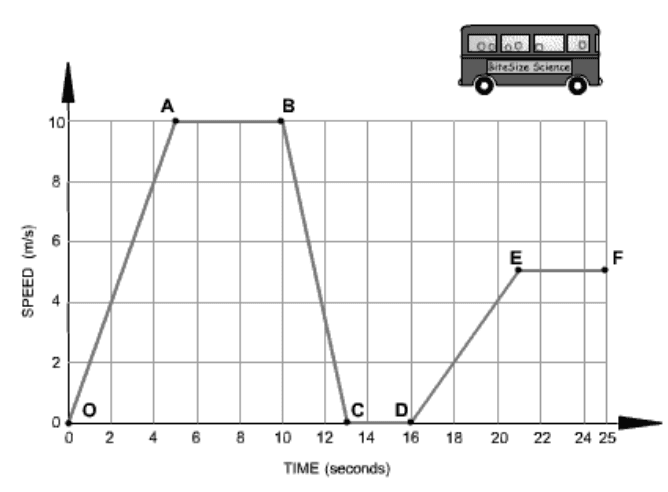
In Segment C-D, the bus is ________________. It has stopped.
In Segment B-C, the bus is ________________. It is slowing down from 10 m/s to rest in 3 seconds
What unit of distance is shown on the y-axis?
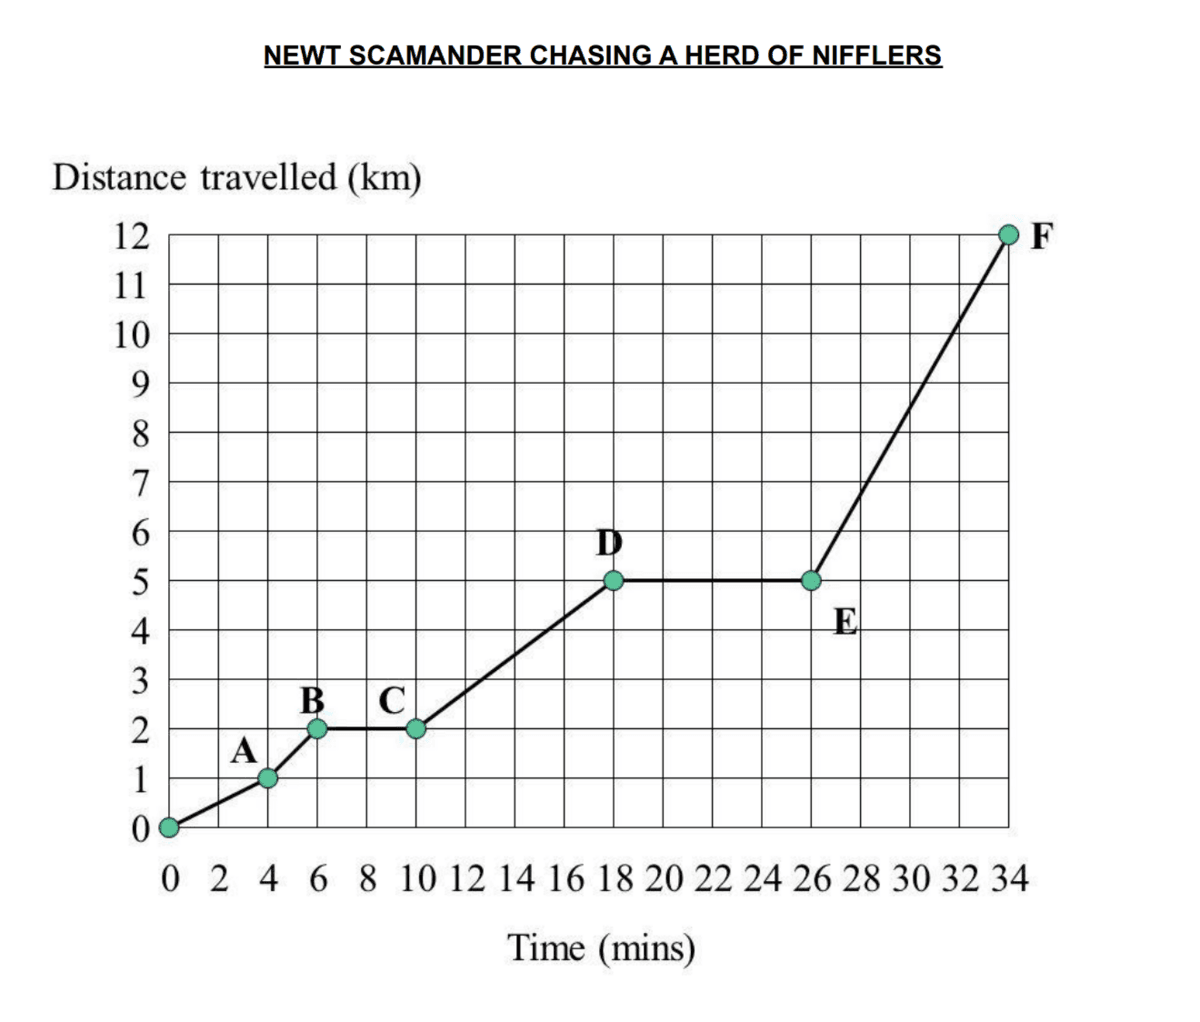
How many minutes was Newt stopped for?
Does Newt move backwards at all?
What segment shows the fastest speed?