Loading...
Review for Final Exam - Probability and Statistics
Quiz by Raymond Taguitay
Tag the questions with any skills you have. Your dashboard will track each student's mastery of each skill.
Identify the given symbol: x̄
Identify the given symbol: s
Identify the given symbol: s2
Identify the given symbol: p
Identify the given symbol: p̂
Identify the given symbol: q
Identify the given symbol: df
ap gve g

Identify the given symbol: X2
Identify the given symbol: n
Identify the given symbol: U
Identify the given symbol: z
Identify the given symbol: t
Given the values: 98, 98, 120, 81, 95, 94, 104, 117, 113, 115, 117, 80, 81, 109, 81
Find the mean
Given the values: 98, 98, 120, 81, 95, 94, 104, 117, 113, 115, 117, 80, 81, 109, 81
Find the median
Given the values: 98, 98, 120, 81, 95, 94, 104, 117, 113, 115, 117, 80, 81, 109, 81
Find the mode
Given the values: 98, 98, 120, 81, 95, 94, 104, 117, 113, 115, 117, 80, 81, 109, 81
Find the range
Given the values: 98, 98, 120, 81, 95, 94, 104, 117, 113, 115, 117, 80, 81, 109, 81
Find the standard deviation
Given the values: 98, 98, 120, 81, 95, 94, 104, 117, 113, 115, 117, 80, 81, 109, 81
Find the variance
Given the values: 98, 98, 120, 81, 95, 94, 104, 117, 113, 115, 117, 80, 81, 109, 81
Find the minimum
Given the values: 98, 98, 120, 81, 95, 94, 104, 117, 113, 115, 117, 80, 81, 109, 81
Find Q1
Given the values: 98, 98, 120, 81, 95, 94, 104, 117, 113, 115, 117, 80, 81, 109, 81
Find Q2
Given the values: 98, 98, 120, 81, 95, 94, 104, 117, 113, 115, 117, 80, 81, 109, 81
Find Q3
Given the values: 98, 98, 120, 81, 95, 94, 104, 117, 113, 115, 117, 80, 81, 109, 81
Find the maximum
A box contains 5 blue chips, 7 black chips, 2 white chips, and 4 red chips. One chip is drawn randomly. What is the probability that it is white or red?
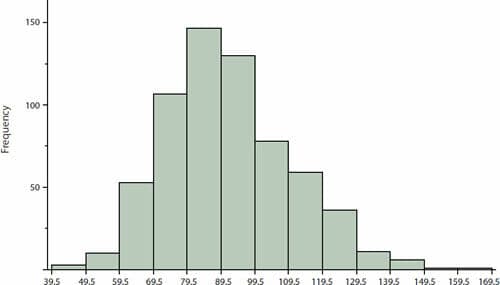
The given chart/graph is an example of?
Mr. Robinson’s wardrobe consists of four suits, six pairs of shoes, five shirts, and ten neckties. How many different outfits can Mr. Robinson make?
If two cards are drawn from a standard deck without replacement, find the probability that the cards will be a jack and a queen.
Use the given table to answer the following question:
Question: Find the probability of selecting a worker with good service, given they are factory trained. P(G|F)
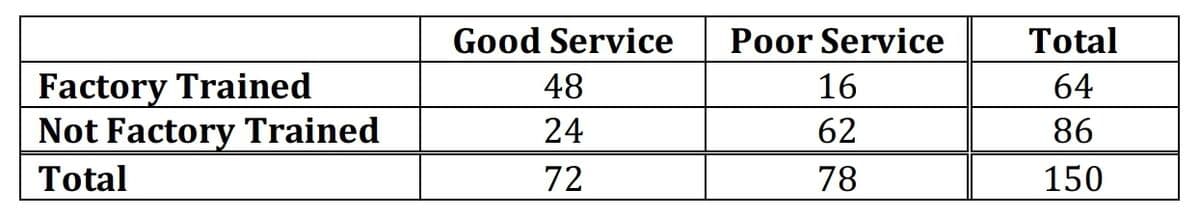
Use the given table to answer the following question:
Question: Find the probability of selecting a worker with good service. P(G)
Use the given table to answer the following question:
Question: Find the probability of selecting a worker that is not factory trained or a worker with bad service. P(NF ∪ P)
Use the given table to answer the following question:
Question: Find the probability of selecting a worker with good service and who is also factory trained. P(G ∩ F)
A committee of four students is to be selected at random from a pool of eleven freshmen and eight sophomores. What is the probability that the committee has two freshmen and two sophomores?
Use the given table to answer the following question:
Question: What is the standard deviation?

Use the given table to answer the following question:
Question: What is the mean?
Use the given table to answer the following question:
Question: What is the variance?
In a binomial experiment with n = 10 and p = 0.2, Find the probability of less than 3 successes.
In a binomial experiment with n = 10 and p = 0.2, what is q?
In a binomial experiment with n = 10 and p = 0.2, Find the probability of 4 successes.
A random variable has a normal distribution with μ = 42.7 and % = 3.2. Which side will be shaded?
A random variable has a normal distribution with μ = 42.7 and % = 3.2. What is the probability that the random variable will take on a value of more than 35?
A random variable has a normal distribution with μ = 42.7 and % = 3.2. What is z?
A random sample of six students took an average of 20.3 minutes to fill out a registration form with a standard deviation of 2.5 minutes. Construct a 95% confidence interval for the population mean time that it takes to complete a registration form.
A hospital wants to estimate the mean number of blood tests given to patients each day. Hospital records show that in a randomly selected sample of 90 days, the average number of blood tests was 85, with a standard deviation of 9.2. In constructing a confidence interval, which table are you using?
In a survey, 140 out of 500 people interviewed in a large city said that they shop in the downtown area at least once a week. In constructing a confidence interval, which table are you using?
A random sample of six students took an average of 20.3 minutes to fill out a registration form with a standard deviation of 2.5 minutes. In constructing a confidence interval, which table are you using?
A hospital wants to estimate the mean number of blood tests given to patients each day. Hospital records show that in a randomly selected sample of 90 days, the average number of blood tests was 85, with a standard deviation of 9.2. Construct a 95% confidence interval for the mean number of blood tests given to patients each day.
30% of families moving out of California move to Arizona. In a random sample, it is found that 104 out of 400 families were moving to Arizona from California. Test whether the true proportion of families moving to Arizona is less than 30% at the & = 0.01 level of significance.
What is decision and summary?
30% of families moving out of California move to Arizona. In a random sample, it is found that 104 out of 400 families were moving to Arizona from California. Test whether the true proportion of families moving to Arizona is less than 30% at the & = 0.01 level of significance.
What type of tailed is the problem?
30% of families moving out of California move to Arizona. In a random sample, it is found that 104 out of 400 families were moving to Arizona from California. Test whether the true proportion of families moving to Arizona is less than 30% at the & = 0.01 level of significance.
What are the hypotheses?
30% of families moving out of California move to Arizona. In a random sample, it is found that 104 out of 400 families were moving to Arizona from California. Test whether the true proportion of families moving to Arizona is less than 30% at the & = 0.01 level of significance.
What is the critical value?
30% of families moving out of California move to Arizona. In a random sample, it is found that 104 out of 400 families were moving to Arizona from California. Test whether the true proportion of families moving to Arizona is less than 30% at the & = 0.01 level of significance.
What is z?