Loading...

Review of Ratio
Quiz by Renz Laylo Santos
Customize this quiz to suit your class
Instantly translate to 100+ languages
Tag the questions with any skills you have. Your dashboard will track each student's mastery of each skill.
Give this quiz to my class
What is the ratio of apples to bananas?

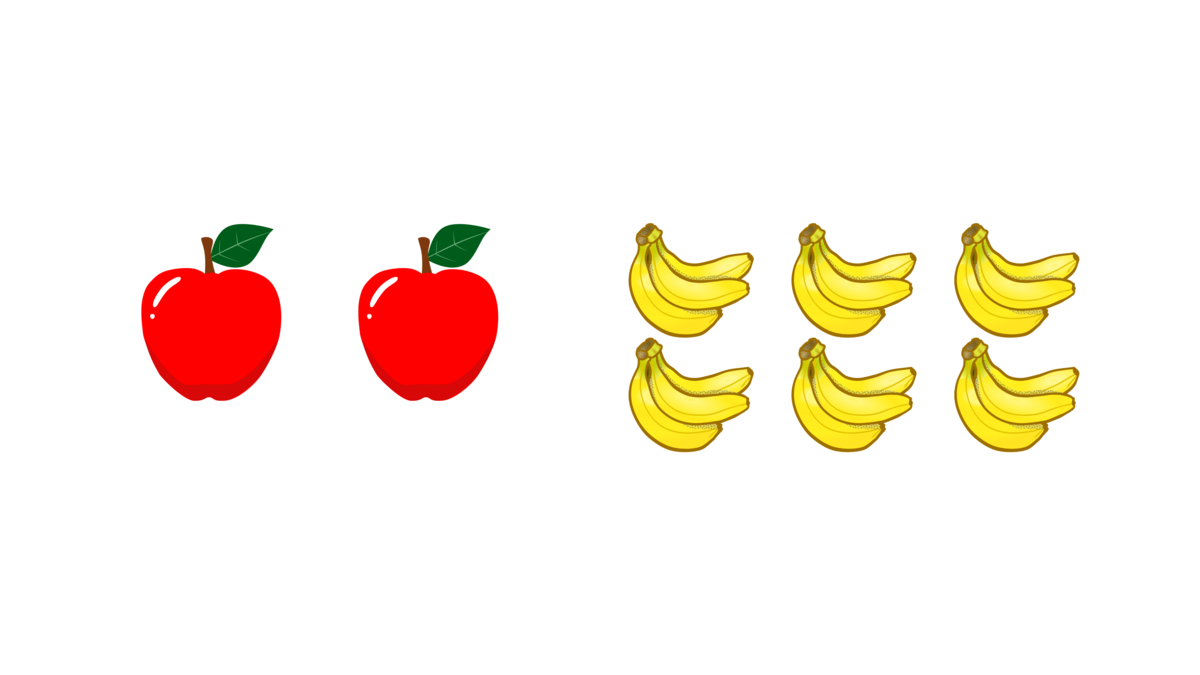
2 apples to 6 bananas
18 apples to 2 bananas
6 apples to 10 bananas
2 apples to 18 bananas
What is the ratio of chicks to tomatoes?

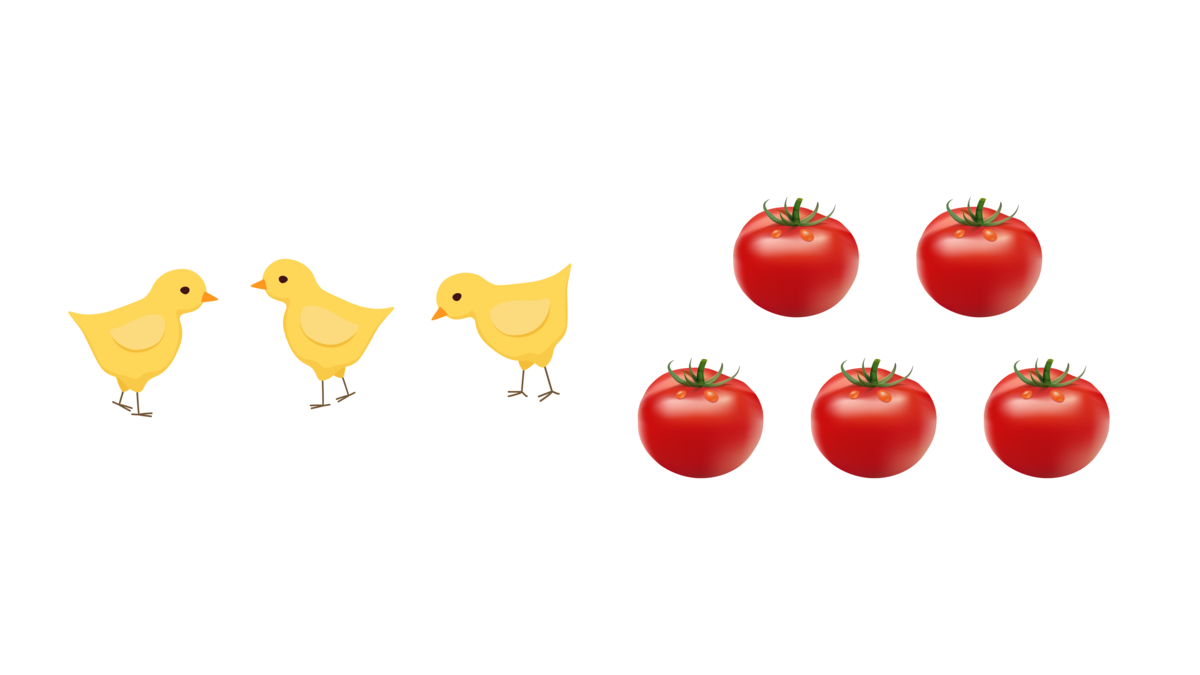
3 chicks to 6 tomatoes
6 chicks to 3 tomatoes
3 chicks to 5 apples
3 chicks to 5 tomatoes
What is the ratio of apples to bananas?

What is the ratio of chicks to tomatoes?

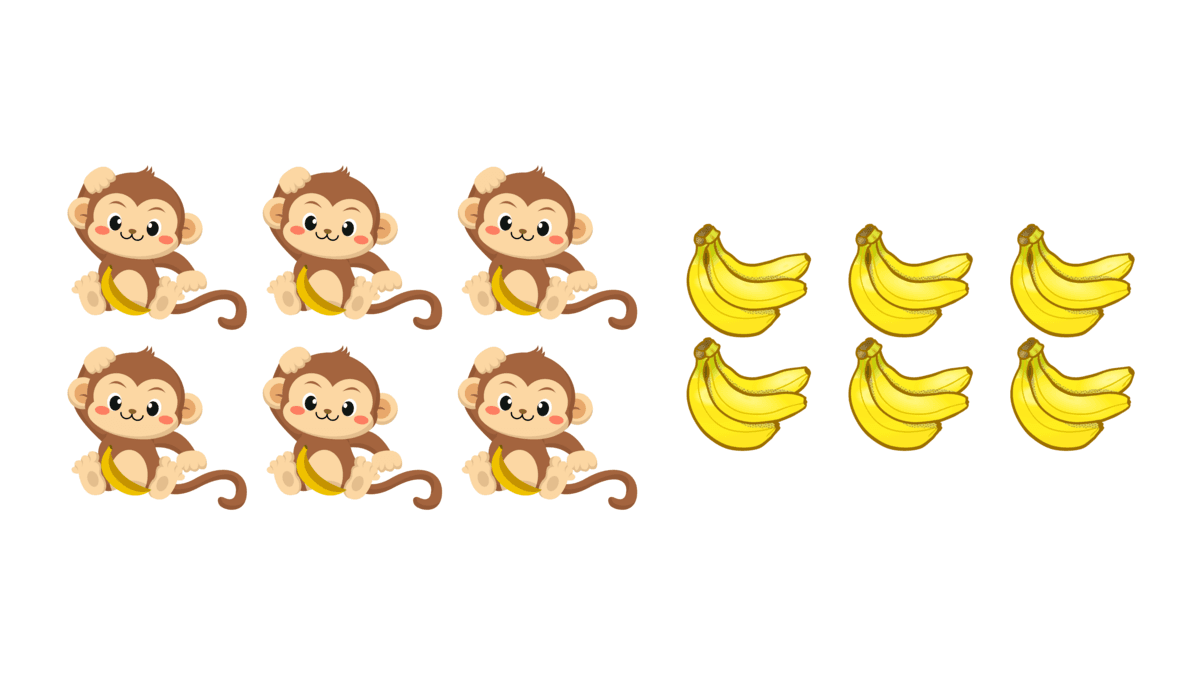
What is the ratio of monkeys to bananas?

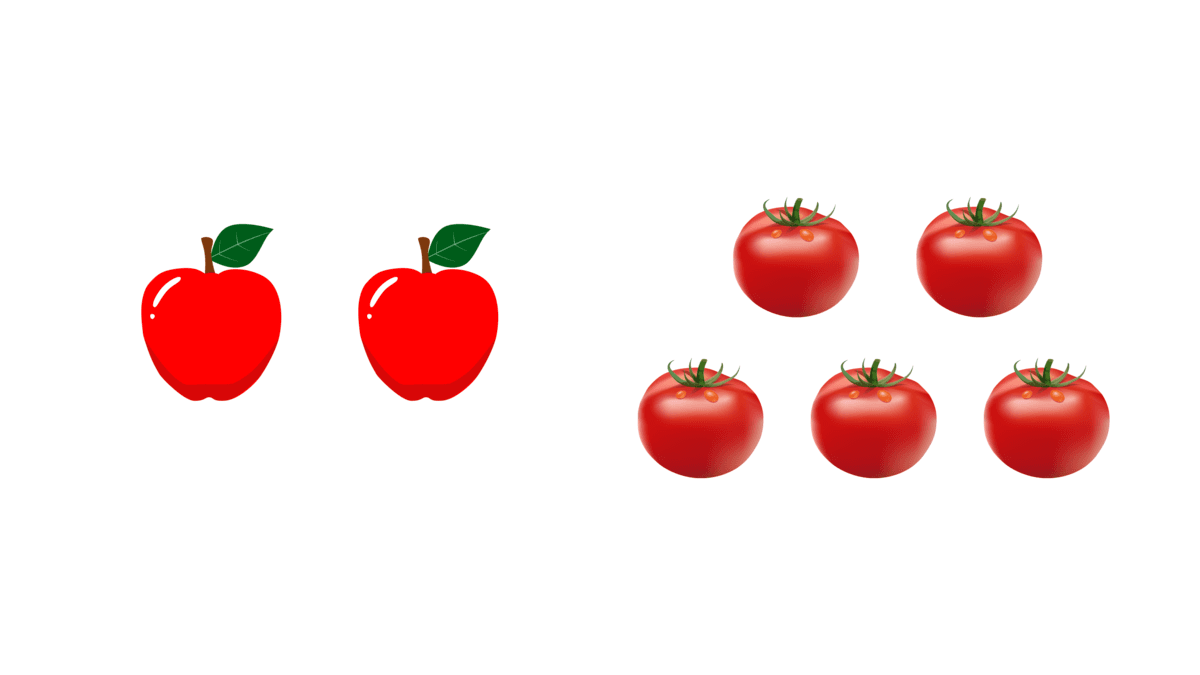
What is the ratio of apples to tomatoes?

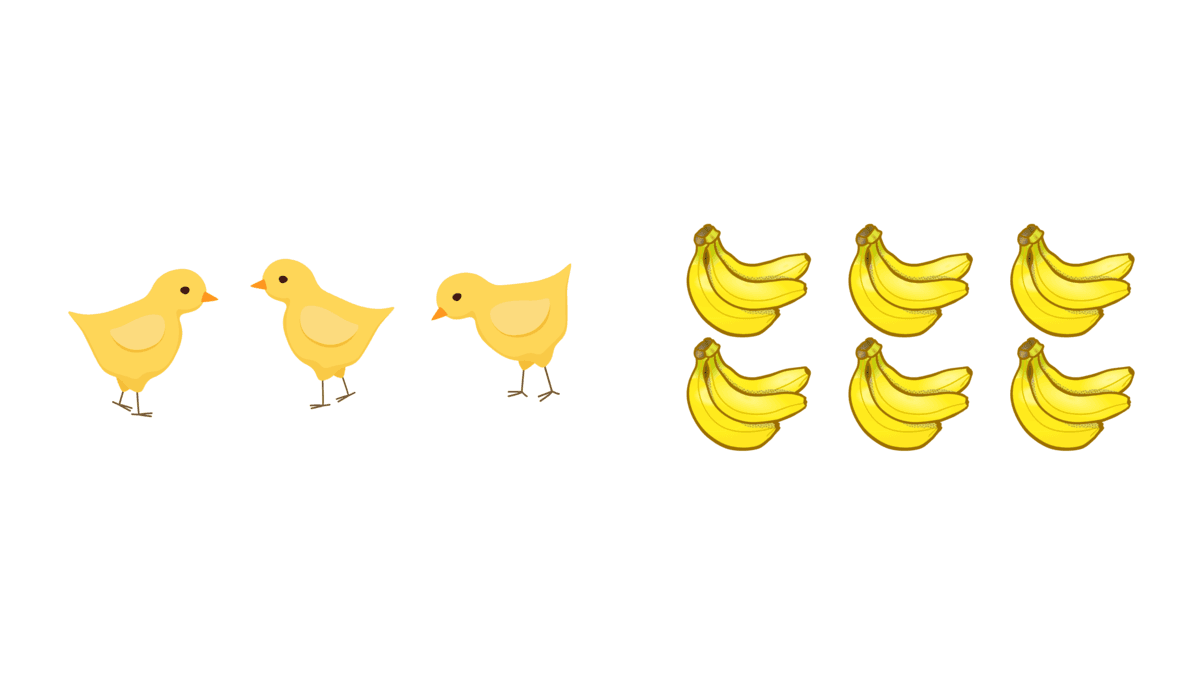
What is the ratio of chicks to bananas?

Review of Rational Expressions
Review of Ratios and Rates - Starter Quiz
Received: 26 November 2019 Revised: 10 January 2020 Accepted: 19 January 2020 DOI: 10.1111/obr.13005 PEDIATRICS/PHYSIOLOGY Adipokines: A gear shift in puberty Desirée Nieuwenhuis | Natàlia Pujol-Gualdo Amanda J. Kiliaan Department of Anatomy, Radboud university medical center, Donders Institute for Brain, Cognition and Behaviour, Preclinical Imaging Center PRIME, Nijmegen, The Netherlands Correspondence Amanda J. Kiliaan, PhD, Associate Professor, Department of Anatomy, Donders Institute for Brain, Cognition, and Behaviour, Preclinical Imaging Center PRIME, Radboud university medical center, 6500 HB Nijmegen, Geert Grooteplein 21N 6525 EZ Nijmegen, The Netherlands. Email: amanda.kiliaan@radboudumc.nl Funding information Europees Fonds voor Regionale Ontwikkeling (EFRO), Grant/Award Number: BriteN 2016 1 | INTRODUCTION The prevalence of obesity in adolescents and children is increasing in | Ilse A.C. Arnoldussen | Summary In this review, we discuss the role of adipokines in the onset of puberty in children with obesity during adrenarche and gonadarche and provide a clear and detailed overview of the biological processes of two major players, leptin and adiponectin. Adipokines, especially leptin and adiponectin, seem to induce an early onset of puberty in girls and boys with obesity by affecting the hypothalamic-pituitary- gonadal (HPG) axis. Moreover, adipokines and their receptors are expressed in the gonads, suggesting a role in sexual maturation and reproduction. All in all, adipokines may be a clue in understanding mechanisms underlying the onset of puberty in child- hood obesity and puberty onset variability. KEYWORDS adipokines, obesity, puberty 1,2 the age of 5 years were overweight or were with obesity in 2016, and 3 Obesity is defined by an excessive accumulation of white adipose tissue (WAT), and it is often indicated by a body mass index (BMI) 4 above 30. Two main types of adipose tissue were described: WAT and brown adipose tissue (BAT), which differ in morphology and func- 5-7 Ilse A.C. Arnoldussen and Amanda J. Kiliaan contributed equally to this work. This is an open access article under the terms of the Creative Commons Attribution License, which permits use, distribution and reproduction in any medium, provided the original work is properly cited. © 2020 The Authors. Obesity Reviews published by John Wiley & Sons Ltd on behalf of World Obesity Federation Obesity Reviews. 2020;21:e13005. wileyonlinelibrary.com/journal/obr 1 of 10 https://doi.org/10.1111/obr.13005 alarming rates. Specifically, worldwide, 41 million children below this number is expected to increase to 70 million in 2025. obesity is associated with various severe health complications, includ- ing increased risk of diabetes mellitus type 2, hypertension, heart dis- eases, and disturbances in sex hormone levels. 5,6 and mitochondria and plays a role in thermogenesis. Adipocytes in tion. BAT consists of adipocytes containing multiple lipid droplets WAT contain only a few mitochondria and a single lipid droplet. Adipose tissue has several functions including the storage of energy, thermogenesis, and the production and secretion of adipokines Generally, two physiological processes, adrenarche and gonadarche, 11,24 Childhood 5,7,8 a key role in puberty onset. Puberty is known as a period through which the body changes physically, being a physiological process resulting in the maturation of children, i.e. they develop sexual characteristics and obtain reproduc- 9,11 Adipokines are involved in a number of physiological processes including blood pressure, metabo- lism, glucose, and vascular homeostasis and may play amongst others 8-10 (hormones, cytokines, and peptides). tive functions. between obesity and puberty,2,12-23 the biological mechanisms under- lying obesity and puberty onset remain unclear. Hereafter, we review in detail the role of adipokines in the onset of puberty in childhood obesity. Although many studies have shown associations 2 | INITIATION OF PUBERTY PHYSIOLOGICAL PROCESSES IN THE interact to regulate the onset of puberty. During adrenarche, the adrenal cortex secretes steroid hormones (including 2 of 10 NIEUWENHUIS ET AL. androstenedione, dehydroepiandrosterone, dehydroepiandrosterone sulfate (DHEAS), androstenedione, and cortisol), insulin-like growth factor, and growth hormone, which contribute to the pubertal insights on new genetic loci (e.g. melanocortin-4 receptor, mitochon- drial carrier 2, and mitogen-activated protein kinase 13) and on sev- eral pathways that regulate the timing of puberty; however, it partly 34 9,24,25 Both adrenarche and gonadarche are involved in the development growth spurt, body odor, skin oiliness, and skeletal maturation. explains puberty timing variation. Thereby, defining the role of 25 adipokines is of importance in elucidating the variability in puberty as the expression of adipokines is sex-specific and is altered with body composition, adiposity, and during growth spurts. Moreover, adipokines and their receptors are expressed in gonads and several brain regions suggesting involvement in the onset of puberty and sex- ual maturation. Lastly, adipokines interfere in processes regulating timing and duration of puberty, for instance in the HPA and HPG axes which are both key players during adrenarche and gonadarche. Involvement of adipokines in the onset of puberty and specifically in individuals with obesity will be further reviewed in the next 2,24 3 | Puberty onset in girls is assessed using different markers, such as thelarche (breast development), menarche (the start of of pubic hair. pituitary-gonadal (HPG) axis is activated,2,26 and several hormones have been identified to participate in the activation of the HPG axis During gonadarche (Figure 1), the hypothalamic- 2,27 Kisspeptin, neurokinin B, and dynorphin are released by specialized including kisspeptin, neurokinin B, dynorphin, leptin, and ghrelin. 28 key regulator of the pulsatile secretion of gonadotropin releasing neurons, the KNDy neurons in the hypothalamus. Kisspeptin is a 29,30 B stimulates, and dynorphin inhibits the release of kisspeptin, which hormone (GnRH) from the hypothalamus. In addition, neurokinin implies that both coordinate a pulsatile release of kisspeptin. 31 Sub- sections. sequently, the activated HPG axis induces the pituitary gland to secrete luteinising hormone (LH) and follicle stimulating hormone (FSH). As a result, gametogenesis occurs, and the gonads will release sex hormones. Consequently, secondary sex characteristics develop including breast development in girls and an increased testicular vol- 2,26,32 is possibly due to differences in levels of body fat, hypothalamic-pitui- THE ONSET OF PUBERTY IN GIRLS ume in boys. The age at puberty onset varies greatly among individuals, which 19 35 menstruation), and pubic hair development. 33 genome-wide association studies have provided important new tary-adrenal (HPA) axis activity, and genetic background. Recent The average age of However, this age differs between cultures and ethnicities, and since 1980, age at menarche is girls at start of menarche is 12.4 years. 36 significantly decreasing. 36-39 F I G U R E 1 Hormonal regulation in the initiation of puberty in boys and girls. The secretion of kisspeptin, neurokinin B, and dynorphin from KNDy neurons initiate the release of gonadotropin releasing hormone (GnRH) from the hypothalamus. This activates the pituitary gland to produce and secrete luteinising hormone (LH) and follicle stimulating hormone (FSH), which in turn stimulate the gonads to produce estrogen and testosterone in girls and boys, respectively 1467789x, 2020, 6, Downloaded from https://onlinelibrary.wiley.com/doi/10.1111/obr.13005, Wiley Online Library on [10/03/2024]. See the Terms and Conditions (https://onlinelibrary.wiley.com/terms-and-conditions) on Wiley Online Library for rules of use; OA articles are governed by the applicable Creative Commons License NIEUWENHUIS ET AL. 3 of 10 T A B L E 1 Summary of included studies Authors Year Country Study Design Primary Outcome Sex Sample Size (n) Age (y) Data Collection Lian et al21 2019 China Cross-sectional Puberty starts earlier in Chinese Han girls with obesity compared with Chinese Han girls with normal weight. Girls 2996 9-19 2012 and 2013 Biro et al12 Lazzeri et al20 2018 USA 2018 Italy Longitudinal Cross-sectional Body mass index had a greater effect on age at menarche than did race and ethnicity. Girls 946 6-16 2004-2014 Li et al23 2018 China Longitudinal For both, boys and girls, a higher BMI (ie, overweight and obese) is associated with earlier onset of puberty Girls Girls Boys Girls 542 Deng et al22 Flom et al15 2017 China Cross-sectional Increased BMI is associated with early timing spermarche and menarche. Boys Girls Girls 1278258 9-15 2005-2012 He et al24 Holmgren et al17 2017 China 2017 Sweden Cross-sectional Longitudinal Onset of puberty is not related to obesity in boys. Boys Boys Girls Girls 782 7-17 972 929 5839 Kelly et al19 2017 UK 2016 Brazil 2016 USA Longitudinal prospective cohort Higher BMI in girls is associated with the onset of menstruation at an earlier age. 11 10-18 11-17 Barcellos Gemelli et al25 Cross-sectional Longitudinal Excess weight is associated with early age of menarche. Girls 727 2014 2003-2009 Glass et al16 Lee et al26 In girls, but not in boys, greater adiposity is associated with the earlier onset of puberty. Boys Girls 135 Cabrera et al27 Leonibus et al14 2014 USA 2013 Italy Cross-sectional Longitudinal Thelarche occurred earlier than recently reported, while age of menarche remained unchanged. Girls 610 3-17.9 2007 2005-2012 Currie et al13 2012 Europe, USA, Canada Cross-sectional Overweight/obesity during childhood predicts the early onset of puberty in girls. Girls 20410 11, 13, 15 2005-2006 2017 USA Prospective birth cohort Overweight/obese status at the age of 7 ye was associated with increased risk of early menarche 788 From birth to menarche occurred Pregnancies 1959-1966 2016 USA Cross-sectional Boys with overweight enter puberty earlier compared with boys with normal weight or obesity, while puberty starts later in boys with obesity compared with boys with normal weight and overweight. Boys 3872 6-16 2005-2010 Overweight during childhood shows a relation with the early onset of puberty in girls. 6535 4259 695 11 15 5.8-12.2 2009/2010 2013/2014 2014-2017 Higher BMI during childhood is associated with early puberty. 2008 and 2009 2000-2002 Obesity during childhood is related to the earlier onset of puberty. Boys Girls 84 123 71 (Continues) 1467789x, 2020, 6, Downloaded from https://onlinelibrary.wiley.com/doi/10.1111/obr.13005, Wiley Online Library on [10/03/2024]. See the Terms and Conditions (https://onlinelibrary.wiley.com/terms-and-conditions) on Wiley Online Library for rules of use; OA articles are governed by the applicable Creative Commons License 4 of 10 NIEUWENHUIS ET AL. 3.1 | Fat storage For the initiation of puberty, the timing of stimulation and/or inhibi- tion of different hormones is important, and additionally, a certain amount and distribution of body fat is needed in order to start menar- che, which emphasizes the importance of body fat. From an evolution- ary point of view, body fat increases in mammalian females during puberty onset, and it highlights the need to guarantee a healthy preg- 40 women with anorexia nervosa. particularly body fat localized predominantly on the gluteofemoral fat depots, is profoundly associated with start of menarche, more than nancy, offspring, and maternal survival. fat, sex-hormones, and neuroendocrine alterations can evolve in men- strual dysfunction, for instance, in women with severe obesity or in 41-43 44-46 to gluteofemoral fat depots suggesting that leptin may convey infor- amount of total body fat. mation on body fat distribution to the hypothalamus during puberty. An improper level of body Importantly, body fat distribution, Blood leptin levels are strongly related 45 3.2 | HPG axis The HPG axis is activated by the release of kisspeptin resulting in the release of GnRH from the hypothalamus, and LH and FSH from the pituitary gland. In girls, FSH is involved in the development of the folli- cles in the ovaries, and it promotes the secretion of estrogen. LH stim- ulates the production of androgen hormones and induces ovulation 48 9,47 the release of kisspeptin and neurokinin B, and kisspeptin thereby (Figure 1). The secretion of estrogen has an inhibitory effect on inhibits the GnRH release from the hypothalamus. pattern of GnRH is important for the regulation of the menstrual cycle. This roughly 28-day-cycle comprises several phases, including the follicular phase and luteal phase. During the follicular phase, increasing levels of FSH stimulate the maturation of follicles and the production of estrogen from the ovaries. This in turn inhibits the release of FSH from the pituitary gland. A high level of estrogen will induce the production of LH by the pituitary gland, resulting in ovula- tion. The matured follicle secretes progesterone thereby inhibiting the release of GnRH. When the corpus luteum is demolished, there is less 48 3.3 | Adipokines According to results from studies reported in Table 1, girls with obe- sity enter puberty earlier compared with girls with normal higher leptin concentrations inhibit the intake of food and increases inhibition of GnRH. As a consequence, the cycle will start again. whole process, starting from the activated HPG axis, results in the development of the secondary sex characteristics in girls including 9,47 thelarche and menarche. 13,14,16-23,49-51 weight. these girls might be found in the secretion of adipokines. For instance, leptin is positively associated with the amount of body fat. Generally, energy expenditure. 9,52-54 An explanation for the early onset of puberty in The expression This TABLE 1 (Continued) Authors Year Country Study Design Primary Outcome Sample Sex Size (n) Age (y) Data Collection Herman-Giddens et al28 2012 USA Cross-sectional Observed mean ages of beginning genital and pubic hair growth and early testicular volumes were earlier than in past studies, depending on the characteristic and race/ethnicity. Boys 4131 6-16 2005-2010 Sorensen et al29 Aksglaede et al30 2010 2009 Denmark Denmark Cross-sectional/longitudinal Longitudinal Puberty onset at earlier ages was associated with an increased BMI in boys. Boys 1528 5.8-19.9 1991-1993/2006-2008 1930-1969 Juul et al31 Ribeiro et al32 2007 2006 Denmark Portugal Retrospective cohort Cross-sectional Higher BMI is associated with early voice break. 11-15 10-15 1990-1999 Kaplowitz et al18 Abbreviation: BMI, body mass USA Cross-sectional The early onset of puberty in Caucasian girls is likely related to an increased BMI. 5-12 1992-1993 2001 index. The higher BMI in boys and girls at 7 y of age, the earlier they enter puberty. Boys 21 612 Girls 135 223 Boys 463 Boys 382 Girls 437 Girls 10 750 Early sexual maturation in boys and girls is associated with overweight. 1467789x, 2020, 6, Downloaded from https://onlinelibrary.wiley.com/doi/10.1111/obr.13005, Wiley Online Library on [10/03/2024]. See the Terms and Conditions (https://onlinelibrary.wiley.com/terms-and-conditions) on Wiley Online Library for rules of use; OA articles are governed by the applicable Creative Commons License NIEUWENHUIS ET AL. 5 of 10 Leptin may possibly play a role in adrenarche as its plasma level increases with higher levels of body fat and as it can modulate both girls. 33 ing adrenarche. In coherence, in children with obesity, the androgen These findings suggested that lower reproductive status was associated with higher total adiponectin concentrations and that a higher reproductive status was related to higher HMW adiponectin the HPA and HPG axes. These axes are functionally integrated dur- DHEAS was positively associated with leptin levels. Nevertheless, concentrations in girls. In addition, individuals with obesity often another study showed that enhanced adrenal androgen secretion in girls with premature adrenarche was not explained by leptin or BMI 55 ated with androgen levels in girls ; however, it was not related to levels. and IL-6. TNF-α alters, and IL-6 inhibits the expression of 56 8 In addition, the adipokine adiponectin was negatively associ- 57 differences of adiponectin seem to develop during the progression of 56 adiponectin (Figure 2). Thereby, a low level of total adiponectin and/or high levels of inflammatory cytokines in individuals with obe- sity can promote the onset of puberty. Many more adipokines are secreted by WAT including omentin, 52,65-67 9,36,62,68 adrenarche in girls with Prader-Willi syndrome. Interestingly, sex puberty. adrenarche; however, both are not required factors. Thus, leptin and adiponectin might be able to influence In gonadarche, leptin can stimulate the secretion of kisspeptin, and subsequently activation of the HPG axis, which eventually increases the expression of estrogen and androstenedione in the ova- 58 2,60 65-67 The expression of these ries (Figure 2). Ob gene in WAT, resulting in the synthesis and secretion of leptin. Thus, high levels of leptin promote onset of puberty in girls via secre- tion of kisspeptin, and estrogen stimulates leptin secretion addition- ally. Moreover, adiponectin can affect the HPG axis due to the expression of adiponectin receptors in the hypothalamus, pituitary In return, estrogen stimulates the expression of the 59 gland, and gonads. onset as it inhibits the secretion of kisspeptin and GnRH in the hypo- thalamus and the release of GH and LH in the pituitary gland, and 2,60-62 52,60 63 girls with central precocious puberty (CPP). Moreover, total adiponectin had negative correlations with progression of puberty in girls (defined by Tanner stages), whereas HMW adiponectin had FIGURE 2 Adipokinesaffectingthe initiation of puberty in girls. Leptin stimulates the release of kisspeptin in KNDy neurons, which activates the hypothalamus to produce gonadotropin releasing hormone (GnRH). In response to the release of GnRH, the pituitary gland secretes follicle stimulating hormone (FSH) and luteinising hormone (LH), which stimulates the ovaries to release estrogen resulting in the formation of secondary sex characteristics in girls. Estrogen stimulates the production of leptin. Adiponectin inhibits GnRH release resulting in reduced levels of GnRH and thereby a delayed onset of puberty. TNF- α and IL-6 inhibit the production of adiponectin and therefore stimulate the onset of puberty In detail, adiponectin is a regulator of puberty thereby inhibiting the onset of puberty (Figure 2). with obesity often have low levels of adiponectin. et al. showed that total adiponectin was significantly lower, whereas high molecular weight (HMW) adiponectin was significantly higher in ment. 55 63 develop a chronic low-grade inflammatory state, which can be indi- cated by a high level of circulating inflammatory cytokines like TNF-α 64 Individuals Sitticharoon positive associations with LH levels and the progression of puberty in 63 visfatin, resistin, and chemerin. and visfatin are expressed in the ovaries. adipokines in the ovaries suggests a role within the reproductive sys- tem; however, the exact biological processes have to be examined. Thus, specifically leptin, adiponectin, and inflammatory cytokines pro- duced by WAT could be permissive key players during an early onset of puberty in girls with obesity. As an exception, HMW adiponectin seems to have a stimulatory effect on peripheral repro- ductive function as HMW is not able to cross the blood brain 63 barrier. 4 | Markers that are used to assess puberty onset in boys are THE ONSET OF PUBERTY IN BOYS spermarche, voice break, testicular volume, and pubic hair develop- 35 spermarche develop in the early stages of puberty onset, voice In women, omentin, chemerin, While pubic hair development, larger testicular volume, and 69 testicular volume increases, which occurs at an average age of break usually appears in later stages of puberty. Generally, first 1467789x, 2020, 6, Downloaded from https://onlinelibrary.wiley.com/doi/10.1111/obr.13005, Wiley Online Library on [10/03/2024]. See the Terms and Conditions (https://onlinelibrary.wiley.com/terms-and-conditions) on Wiley Online Library for rules of use; OA articles are governed by the applicable Creative Commons License 6 of 10 NIEUWENHUIS ET AL. 11.9 years, followed by the development of pubic hair at 12.2 years of average, and lastly, boys experience spermarche around an aver- 55 related with leptin levels. Thereby, leptin plausibly has a minor impact in adrenarche in boys. Since leptin receptors are found in the hypothalamus, pituitary gland, and testes, they might be involved in the onset of puberty by affecting the HPG axis during gonadarche. Leptin stimulates the release of kisspeptin and GnRH, and as a consequence, it accelerates the onset of puberty (Table 1, Figure 3). In contrast, adiponectin inhibits the secretion of GnRH, GH, LH, and FSH therewith delaying the onset of puberty. However, adiponectin levels are generally lower in men compared with women and even lower in men with obe- age age of 13.4 years. 70 4.1 | Fat storage Many aspects of the reproductive physiology are energetically demanding,71 and therefore, an adequate energy level is necessary. In boys, a dynamic change in body composition occurs around the age of 10 to 13 years, in which they gain approximately 40% of sity. culating inflammatory cytokines. levels can stimulate the HPG axis and therewith an early onset of puberty in boys. Nevertheless, leptin can inhibit the production of tes- 72 mostly consisting of lean mass, which causes exhaustion of most of fat. Subsequently, a growth spurt follows in which they gain tissue 72 in boys, an adequate amount of body fat is important in the onset of their body fat. These alterations in amount of body fat indicate that 4.2 | Puberty in boys is initiated by the release of kisspeptin. As mentioned before, this activates the HPG axis, resulting in the release of GnRH from the hypothalamus, and consequently the release of LH and FSH 9,74 puberty. tosterone from the testes, to estrogen (Figure 3). of the development of secondary sex characteristics in boys. Additionally, leptin can affect fertility in men as it can modulate the nutritional support of spermatogenesis, and moreover, dysfunction of spermatogenesis is associated with an increased leptin level and 73 58 2,60-62 HPG axis from the pituitary gland (Figure 1). and LH stimulates the secretion of testosterone from the testes, which inhibits the release of kisspeptin from the KNDy neurons and 9,48 in men, the release of kisspeptin is more consistent, causing a con- 29,48 subsequently GnRH from the hypothalamus. receptors expressed on KNDy neurons. In humans, KNDy neurons Contrarily to women, LH-induced testosterone levels lead to the stant release of LH. development of secondary sex characteristics in boys. differences between sexes in kisspeptin release are related to a sex- specific and sex steroid-dependent kisspeptin system as estrogen and progesterone modulate kisspeptin activity through the sex-steroid 48 in the infundibular nucleus are involved in negative and positive sex- 48 tal exposure to sex steroids and result in sex-specific differences in steroid feedbacks. kisspeptin release. These sexual dimorphisms are induced by perina- 75,76 4.3 | Adipokines The association between obesity and puberty onset in boys is rather controversial compared with findings in girls. Most studies reported an early onset of puberty in boys associated with increased ate adipose tissue from actual breast tissue. stages are more difficult to assess than female stages as boys lack a more determined marker such as menarche. Thirdly, puberty onset can be indicated by the activation of the HPG axis, and the presence of these secondary sex characteristics is the result of hormonal 2 14,17,22,23,50,51,77,78 BMI, 20,49 all while others reported no associations at Current markers used 79 16,80 or a delayed onset of puberty (Table 1). The presence of excessive adipose tissue can be involved in puberty onset in boys as the secretion of adipokines can modulate both adrenarche and gonadarche. Leptin can affect adrenarche by modulating both the HPG and HPA axes,33 and moreover, androgen levels were positively 55 nal androgen secretion in boys with premature adrenarche was not associated with plasma leptin levels. Nevertheless, enhanced adre- 9 In more detail, 61,62 adiponectin, and individuals with obesity often have high levels of cir- Moreover, inflammatory cytokines, TNF-α, and IL-6, inhibit expression of the leptin receptor in the testis. FSH induces spermatogenesis, too. function and role still have to be examined. 64 High leptin and low adiponectin and fat tissue can convert testosterone Both processes might result in the delay 29,61,79 81,82 In men, other adipokines like chemerin are found in the gonads 65 Thus, particularly high leptin and low adiponectin levels stimulate the HPG axis and thereby accelerate the onset of puberty in boys. Additionally, leptin can dysregulate the development of secondary sex characteristics and spermatogenesis by affecting testosterone levels and nutritional sup- port of spermatogenesis. 5 | LIMITATIONS AND FUTURE RESEARCH DIRECTIONS Even though multiple epidemiological studies have shown the link between puberty onset and obesity, there are some important limita- tions. Firstly, determining both the onset and stage of puberty is rather difficult. For instance, assessing the stage of breast develop- ment in girls with obesity is complicated as clinicians should differenti- 2 changes in response to the activated HPG axis. to determine the onset of puberty refer to secondary sex characteris- tics, such as testicular volume in boys and breast development in girls. A more accurate measurement of puberty onset would be to combine secondary sex characteristics with plasma or serum hormone level measurements such as LH, FSH, adipokines, e.g. leptin. Thereby, differences in puberty measurements could explain variations in the age of puberty onset between boys and girls within different Thereby, resistin is expressed in the testes of rats, but its exact 83 Secondly, male pubertal 1467789x, 2020, 6, Downloaded from https://onlinelibrary.wiley.com/doi/10.1111/obr.13005, Wiley Online Library on [10/03/2024]. See the Terms and Conditions (https://onlinelibrary.wiley.com/terms-and-conditions) on Wiley Online Library for rules of use; OA articles are governed by the applicable Creative Commons License NIEUWENHUIS ET AL. 7 of 10 FIGURE 3 Adipokines affecting the initiation of puberty in boys. Leptin activates kisspeptin secretion in KNDy neurons, this activates the production of gonadotropin releasing hormone (GnRH) from the hypothalamus. GnRH stimulates the pituitary gland to secrete follicle stimulating hormone (FSH) and luteinising hormone (LH), activating the production of testosterone from the testes allowing the development of secondary sex characteristics. Leptin also inhibits the production of testosterone, which may cause a delayed onset of puberty. Adiponectin inhibits GnRH release. Low levels of adiponectin, as a result of TNF-α and IL-6 expression, lead to a reduced inhibition of GnRH. In response to GnRH release, the pituitary gland will secrete FSH and LH, and the testes will produce testosterone resulting in the development of secondary sex characteristics in boys countries, and In addition, the inclusion of a of puberty. ferent time points is complicated, as subjects examined several decades ago presented pronounced differences concerning lifestyle patterns such as nutrition and exercise habits. Lastly, obesity or over- weight is often determined by BMI, a classification based on weight and height measurements. Additionally, it is important that all studies studies or across continents, ethnicities proper age range (8-16 years) is important when assessing the onset (Figure 4). 12-15,17,20-23,49,77-79,84,85 30,47 Furthermore, comparison between studies from dif- 86 Specifically in children, BMI is often dependent on age and growth use the same anthropometric standards and sex-specific cut-offs. 13,14,16-23,49-51,77-80 fat and would represent a more accurate measurement in its regard. Based on this review, several suggestions can be made for further research. Firstly, the roles of adipokines like resistin, chemerin, visfatin, and omentin in puberty onset, fertility, and sexual maturation should be examined in detail. Secondly, future research examining the onset of puberty should combine indicators of puberty onset (e.g. breast development or testicular volume) with plasma or serum hor- mone measurements such as LH, FSH, sex-steroids, adipokines (e.g. spurts. ment in case of growth spurts. distribution of body fat should be taken into account in determining puberty and obesity in children. For instance, the body adiposity index (BAI), which was introduced in 2011 by Bergman et al.,87 uses hip cir- cumference and height in order to estimate the percentage of body 87 Thereby, BMI is a less accurate measure- F I G U R E 4 87,88 Therefore, both percentage and Average age of puberty onset in Europe, China, and the United States according to several studies from Table 1. Age of puberty onset ranges from 8.47 to 13.33 years in girls and from 8.63 leptin), and body fat distribution (e.g. BAI,87 waist-hip ratio's and/or dual-energy X-ray absorptiometry (DXA)2). Additionally, defining con- sistent and general measurements of puberty in both boys and girls, combined with a proper age range (8-16 years), would facilitate the comparisons between different studies and their results. 12-15, 17, 20-23, 25-29, 31 to 13.7 years in boys. included if average age of markers used to assess puberty was not reported. Pink: girls. Blue: boys Studies (Table 1) were not 39, 56 1467789x, 2020, 6, Downloaded from https://onlinelibrary.wiley.com/doi/10.1111/obr.13005, Wiley Online Library on [10/03/2024]. See the Terms and Conditions (https://onlinelibrary.wiley.com/terms-and-conditions) on Wiley Online Library for rules of use; OA articles are governed by the applicable Creative Commons License 8 of 10 NIEUWENHUIS ET AL. 6 | CONCLUSION In conclusion, epidemiological data regarding obesity and puberty onset in girls show similar outcomes as adiposity results in the early onset of puberty in girls. The majority of the studies examining boys with obesity indicate an early onset of puberty, while not all reported an earlier onset of puberty. In detail, high leptin, TNF-α, and IL-6 levels combined with low adiponectin levels stimulate the activation of the HPG axis in girls and boys with obesity, and 5, 45, 50, 51 REFERENCES 1. Kumar S, Kelly AS. Review of childhood obesity: from epidemiology, etiology, and comorbidities to clinical assessment and treatment. May- o Clin Proc. 2017;92(2):251-265. 2. Reinehr T, Roth CL. Is there a causal relationship between obesity and puberty? The Lancet Child & adolescent health. 2019;3(1):44-54. 3. WorldHealthOrganization. Facts and figures on childhood obesity. 2017. 4. Guglielmi V, Sbraccia P. Obesity phenotypes: depot-differences in adipose tissue and their clinical implications. Eat Weight Disord. 2018; 23(1):3-14. 5. Gomez-Hernandez A, Beneit N, Diaz-Castroverde S. Escribano O. Dif- ferential role of adipose tissues in obesity and related metabolic and vas- cular complications. 2016;2016:1-15, 1216783. 6. Zwick RK, Guerrero-Juarez CF, Horsley V, Plikus MV. Anatomical, physiological, and functional diversity of adipose tissue. Cell Metab. 2018;27(1):68-83. 7. Gulyaeva O, Dempersmier J, Sul HS. Genetic and epigenetic control of adipose development. Biochimica et Biophysica Acta (BBA)— Molecular and Cell Biology of Lipids. 2019;1864:3-12. 8. Khan M, Joseph F. Adipose tissue and adipokines: the association with and application of adipokines in obesity. Forensic Sci. 2014;2014: 711-724, 328592. 9. Alotaibi MF. Physiology of puberty in boys and girls and pathological disorders affecting its onset. J Adolesc. 2019;71:63-71. 10. Cousminer DL, Stergiakouli E, Berry DJ, et al. Genome-wide associa- tion study of sexual maturation in males and females highlights a role for body mass and menarche loci in male puberty. Hum Mol Genet. 2014;23(16):4452-4464. 11. Ahmed ML, Ong KK, Dunger DB. Childhood obesity and the timing of puberty. Trends in endocrinology and metabolism: TEM. 2009;20(5): 237-242. 12. Biro FM, Pajak A, Wolff MS, et al. Age of menarche in a longitudinal US cohort. J Pediatr Adolesc Gynecol. 2018;31(4):339-345. 13. Currie C, Ahluwalia N, Godeau E, Nic Gabhainn S, Due P, Currie DB. Is obesity at individual and national level associated with lower age at menarche? Evidence from 34 countries in the Health Behaviour in School-aged Children Study. The Journal of adolescent health: official publication of the Society for Adolescent Medicine. 2012;50(6): 621-626. 14. De Leonibus C, Marcovecchio ML, Chiavaroli V, de Giorgis T, Chiarelli F, Mohn A. Timing of puberty and physical growth in obese children: a longitudinal study in boys and girls. Pediatr Obes. 2014; 9(4):292-299. 15. Flom JD, Cohn BA, Tehranifar P, et al. Earlier age at menarche in girls with rapid early life growth: cohort and within sibling analyses. Ann Epidemiol. 2017;27(3):187-93.e2. 16. Glass NA, Torner JC, Letuchy EM, et al. The relationship between greater prepubertal adiposity, subsequent age of maturation, and bone strength during adolescence. Journal of bone and mineral research: the official journal of the American Society for Bone and Min- eral Research. 2016;31(7):1455-1465. 17. Holmgren A, Niklasson A, Nierop AF, et al. Pubertal height gain is inversely related to peak BMI in childhood. Pediatr Res. 2017;81(3): 448-454. 18. Kaplowitz PB, Slora EJ, Wasserman RC, Pedlow SE, Herman- Giddens ME. Earlier onset of puberty in girls: relation to increased body mass index and race. Pediatrics. 2001;108(2):347-353. 19. Kelly Y, Zilanawala A, Sacker A, Hiatt R, Viner R. Early puberty in 11-year-old girls: Millennium Cohort Study findings. Arch Dis Child. 2017;102(3):232-237. 20. Lazzeri G, Tosti C, Pammolli A, et al. Overweight and lower age at menarche: evidence from the Italian HBSC cross-sectional survey. BMC Womens Health. 2018;18(1):168-174. thereby an early onset of obesity. leptin can inhibit the production of testosterone in boys and subse- quently inhibit the development of secondary sex characteristics affecting spermatogenesis. for other adipokines, like resistin and omentin, are present in the testes and ovaries suggesting a role in puberty or reproduction; 58, 71 however, their plausible function is still unknown. that adipokines may be key regulators in an early onset of puberty in both girls and boys with obesity, specifically by affecting the HPG axis during gonadarche. Future research should focus on assessing puberty onset by measuring consistent puberty markers and determine the percentage of body fat and its distribution and adipokines and hormone serum levels particularly involved in the HPG axis. CONFLICTS OF INTEREST The authors declare no conflict of interest. FUNDING INFORMATION This research was funded by Europees Fonds voor Regionale Ontwikkeling (EFRO), project BriteN 2016. ORCID Ilse A.C. Arnoldussen Amanda J. Kiliaan https://orcid.org/0000-0002-7395-5284 https://orcid.org/0000-0002-2158-6210 13, 14, 16-26, 29-32 Furthermore, several receptors Nevertheless, We conclude Search strategy We searched PubMed for articles published before Novem- ber 15th, 2019 using relevant keywords, including ‘onset of puberty and adiposity/obesity’, ‘onset of puberty’, ‘children with obesity’, ‘adipose tissue’, ‘childhood obesity’, ‘adiposity’, ‘obesity’, ‘adipokine(s)’, ‘HPG axis’, ‘adipokines ovary/ova- ries’, or ‘adipokines testes’, either alone or in combination. Selection criteria used were English language, longitudinal or cross-sectional studies assessing the onset of puberty, including menarche, thelarche, spermarche, or voice break, combined with high BMI or obesity/adiposity, and articles assessing or reviewing adipokines and its effects on the reproductive system. 1467789x, 2020, 6, Downloaded from https://onlinelibrary.wiley.com/doi/10.1111/obr.13005, Wiley Online Library on [10/03/2024]. See the Terms and Conditions (https://onlinelibrary.wiley.com/terms-and-conditions) on Wiley Online Library for rules of use; OA articles are governed by the applicable Creative Commons License NIEUWENHUIS ET AL. 9 of 10 21. Lian Q, Mao Y, Luo S, et al. Puberty timing associated with obesity and central obesity in Chinese Han girls. BMC Pediatr. 2019; 19(1):1-7. 22. Deng Y, Liang J, Zong Y, et al. Timing of spermarche and menarche among urban students in Guangzhou, China: trends from 2005 to 2012 and association with Obesity. Sci Rep. 2018;8(1):263-270. 23. Li W, Liu Q. Association of prepubertal obesity with pubertal devel- opment in Chinese girls and boys: a longitudinal study. 2018;30: e23195. 24. Mendle J, Beltz AM, Carter R, Dorn LD. Understanding puberty and its measurement: ideas for research in a new generation. Journal of research on adolescence: the official journal of the Society for Research on Adolescence. 2019;29(1):82-95. 25. Pagani S, Meazza C, Gertosio C, Bozzola E, Bozzola M. Growth hor- mone receptor gene expression in puberty. Hormone and metabolic research = Hormon- und Stoffwechselforschung = Hormones et metabolisme. 2015;47:581-584. 26. Abreu AP, Kaiser UB. Pubertal development and regulation. Lancet Diabetes Endocrinol. 2016;4(3):254-264. 27. Aguirre RS, Eugster EA. Central precocious puberty: from genetics to treatment. Best Pract Res Clin Endocrinol Metab. 2018;32(4): 343-354. 28. Sultan C, Gaspari L, Maimoun L, Kalfa N, Paris F. Disorders of puberty. Best Pract Res Clin Obstet Gynaecol. 2018;48:62-89. 29. Skorupskaite K, George JT, Anderson RA. The kisspeptin-GnRH path- way in human reproductive health and disease. Hum Reprod Update. 2014;20(4):485-500. 30. Dahl SK, Amstalden M, Coolen L, Fitzgerald M, Lehman M. Dynorphin immunoreactive fibers contact GnRH neurons in the human hypothal- amus. Reprod Sci. 2009;16(8):781-787. 31. Navarro VM, Gottsch ML, Chavkin C, Okamura H, Clifton DK, Steiner RA. Regulation of gonadotropin-releasing hormone secretion by kisspeptin/dynorphin/neurokinin B neurons in the arcuate nucleus of the mouse. J Neurosci. 2009;29(38):11859-11866. 32. Zhai L, Liu J, Zhao J, et al. Association of obesity with onset of puberty and sex hormones in chinese girls: a 4-year longitudinal study. PLoS ONE. 2015;10(8):1-12, e0134656. 33. Cizza G, Dorn LD, Lotsikas A, Sereika S, Rotenstein D, Chrousos GP. Circulating plasma leptin and IGF-1 levels in girls with premature adrenarche: potential implications of a preliminary study. Horm Metab Res. 2001;33(3):138-143. 34. Cousminer DL, Widén E, Palmert MR. The genetics of pubertal timing in the general population: recent advances and evidence for sex-spec- ificity. Curr Opin Endocrinol Diabetes Obes. 2016;23(1):57-65. 35. Marshall WA, Tanner JM. Variations in pattern of pubertal changes in girls. Arch Dis Child. 1969;44(235):291-303. 36. Lacroix AE, Whitten R. Physiology. Treasure Island (FL): Menarche. StatPearls. StatPearls Publishing; 2018. 37. McDowell MA, Brody DJ, Hughes JP. Has Age at Menarche Chan- ged? Results from the National Health and Nutrition Examination Sur- vey (NHANES) 1999–2004. J Adolesc Health. 2007;40(3):227-231. 38. de Muinich Keizer SM, Mul D. Trends in pubertal development in Europe. Hum Reprod Update. 2001;7(3):287-291. 39. Talma H, Schönbeck Y, van Dommelen P, Bakker B, van Buuren S, Hirasing RA. Trends in menarcheal age between 1955 and 2009 in the Netherlands. PLoS ONE. 2013;8:e60056-e60056. 40. Kaplan HS, Lancaster JB. An evolutionary and ecological analysis of human fertility, mating patterns, and parental investment. Off- spring: Human fertility behavior in biodemographic perspective. 2003;1: 170-223. 41. Mitan LA. Menstrual dysfunction in anorexia nervosa. J Pediatr Adolesc Gynecol. 2004;17(2):81-85. 42. Xu H, Li P-H, Barrow TM, et al. Obesity as an effect modifier of the association between menstrual abnormalities and hypertension in young adult women: Results from Project ELEFANT. PLoS ONE. 2018; 13(11):e0207929-e0207929. 43. Tauqeer Z, Gomez G, Stanford FC. Obesity in women: insights for the clinician. J Womens Health (Larchmt). 2018;27(4):444-457. 44. de Ridder CM, Thijssen JH, Bruning PF, Van den Brande JL, Zonderland ML, Erich WB. Body fat mass, body fat distribution, and pubertal development: a longitudinal study of physical and hormonal sexual maturation of girls. J Clin Endocrinol Metab. 1992;75(2): 442-446. 45. Lassek W, Gaulin S. Brief communication: menarche is related to fat distribution. Am J Phys Anthropol. 2007;133(4):1147-1151. 46. Loomba-Albrecht LA, Styne DM. Effect of puberty on body composi- tion. Curr Opin Endocrinol Diabetes Obes. 2009;16:10-15. 47. Simonneaux V, Bahougne T. A multi-oscillatory circadian system times female reproduction. Front Endocrinol. 2015;6:1-15. 48. Marques P, Skorupskaite K, George JT, Anderson RA. Physiology of GNRH and gonadotropin secretion. In: Feingold KR, Anawalt B, Boyce A, et al., eds. Endotext. Endotext.org: South Dartmouth (MA); 2000. 49. Barcellos Gemelli IF, Farias EDS, Souza OF. Age at menarche and its association with excess weight and body fat percentage in girls in the Southwestern Region of the Brazilian Amazon. J Pediatr Adolesc Gynecol. 2016;29(5):482-488. 50. Aksglaede L, Juul A, Olsen LW, Sorensen TI. Age at puberty and the emerging obesity epidemic. PLoS ONE. 2009;4:1-6, e8450. 51. Ribeiro J, Santos P, Duarte J, Mota J. Association between over- weight and early sexual maturation in Portuguese boys and girls. Ann Hum Biol. 2006;33(1):55-63. 52. Budak E, Fernandez Sanchez M, Bellver J, Cervero A, Simon C, Pellicer A. Interactions of the hormones leptin, ghrelin, adiponectin, resistin, and PYY3-36 with the reproductive system. Fertil Steril. 2006;85(6):1563-1581. 53. Castellano JM, Tena-Sempere M. Metabolic control of female puberty: potential therapeutic targets. Expert Opin Ther Targets. 2016; 20(10):1181-1193. 54. Venancio JC, Margatho LO, Rorato R, et al. Short-term high-fat diet increases leptin activation of CART neurons and advances puberty in female mice. Endocrinology. 2017;158(11):3929-3942. 55. l'Allemand D, Schmidt S, Rousson V, Brabant G, Gasser T, Gruters A. Associations between body mass, leptin, IGF-I and circulating adrenal androgens in children with obesity and premature adrenarche. Eur J Endocrinol. 2002;146(4):537-543. 56. Böttner A, Jr K, Müller G, et al. Gender Differences of adiponectin levels develop during the progression of puberty and are related to serum androgen levels. J Clin Endocrinol Metabol. 2004;89(8):4053- 4061. 57. Unanue N, Bazaes R, Iñiguez G, Cortes F, Avila A, Mericq V. Adre- narche in Prader-Willi syndrome appears not related to insulin sensi- tivity and serum adiponectin. Horm Res. 2007;67(3):152-158. 58. Michalakis K, Mintziori G, Kaprara A, Tarlatzis BC, Goulis DG. The complex interaction between obesity, metabolic syndrome and repro- ductive axis: a narrative review. Metabolism: clinical and experimental. 2013;62(4):457-478. 59. Machinal-Quelin F, Dieudonne MN, Pecquery R, Leneveu MC, Giudicelli Y. Direct in vitro effects of androgens and estrogens on ob gene expression and leptin secretion in human adipose tissue. Endo- crine. 2002;18(2):179-184. 60. Dobrzyn K, Smolinska N, Kiezun M. Adiponectin: A new regulator of female reproductive system. Int J Endocrinol. 2018;2018:1-12, 7965071. 61. Martin LJ. Implications of adiponectin in linking metabolism to testic- ular function. Endocrine. 2014;46(1):16-28. 62. Mathew H, Castracane VD, Mantzoros C. Adipose tissue and repro- ductive health. Metabolism: clinical and experimental. 2018;86:18-32. 1467789x, 2020, 6, Downloaded from https://onlinelibrary.wiley.com/doi/10.1111/obr.13005, Wiley Online Library on [10/03/2024]. See the Terms and Conditions (https://onlinelibrary.wiley.com/terms-and-conditions) on Wiley Online Library for rules of use; OA articles are governed by the applicable Creative Commons License 10 of 10 NIEUWENHUIS ET AL. 63. Sitticharoon C, Sukharomana M, Likitmaskul S, Churintaraphan M, Maikaew P. Corrigendum to: Increased high molecular weight adiponectin, but decreased total adiponectin and kisspeptin, in central precocious puberty compared with aged-matched prepubertal girls. Reprod Fertil Dev. 2017;29:2506-2517. 64. Das UN. Is obesity an inflammatory condition? Nutrition. 2001; 17(11-12):953-966. 65. Comninos AN, Jayasena CN, Dhillo WS. The relationship between gut and adipose hormones, and reproduction. Hum Reprod Update. 2014; 20(2):153-174. 66. Singh A, Choubey M, Bora P, Krishna A. Adiponectin and chemerin: contrary adipokines in regulating reproduction and metabolic disor- ders. Reproductive sciences (Thousand Oaks, Calif). 2018;25:1462- 1473. 67. Tsatsanis C, Dermitzaki E, Avgoustinaki P, Malliaraki N, Mytaras V, Margioris AN. The impact of adipose tissue-derived factors on the hypothalamic-pituitary-gonadal (HPG) axis. Hormones (Athens). 2015; 14:549-562. 68. Kang MJ, Oh YJ, Shim YS, Baek JW, Yang S. Hwang IT. The usefulness of circulating levels of leptin, kisspeptin, and neurokinin B in obese girls with precocious puberty. 2018;34:627-630. 69. Lee J, Song J, Hootman JM, et al. Obesity and other modifiable fac- tors for physical inactivity measured by accelerometer in adults with knee osteoarthritis: data from the osteoarthritis initiative (OAI). Arthritis Care Res (Hoboken). 2012;53-61. 70. Bramswig J, Dubbers A. Disorders of pubertal development. Deutsches Arzteblatt international. 2009;106:295-303. quiz 04 71. Elias CF, Purohit D. Leptin signaling and circuits in puberty and fertil- ity. Cell Mol Life Sci. 2013;70(5):841-862. 72. Riumallo J, Durnin JV. Changes in body composition in adolescent boys. Eur J Clin Nutr. 1988;42(2):107-112. 73. Siervogel RM, Demerath EW, Schubert C, et al. Puberty and body composition. Horm Res. 2003;60(Suppl 1):36-45. 74. Zhang J. Gong M. Andrologia: Review of the role of leptin in the regu- lation of male reproductive function; 2018. 75. Kauffman AS, Gottsch ML, Roa J, et al. Sexual differentiation of Kiss1 gene expression in the brain of the rat. Endocrinology. 2007;148(4): 1774-1783. 76. Zeydabadi Nejad S, Ramezani Tehrani F, Zadeh-Vakili A. The role of kisspeptin in female reproduction. Int J Endocrinol Metab. 2017;15:1- 11, e44337. 77. Sorensen K, Aksglaede L, Petersen JH, Juul A. Recent changes in pubertal timing in healthy Danish boys: associations with body mass index. J Clin Endocrinol Metab. 2010;95(1):263-270. 78. Juul A, Magnusdottir S, Scheike T, Prytz S, Skakkebaek NE. Age at voice break in Danish boys: effects of pre-pubertal body mass index and secular trend. Int J Androl. 2007;30(6):537-542. 79. Lee JM, Wasserman R, Kaciroti N, et al. Timing of puberty in overweight versus obese boys. Pediatrics. 2016;137(2):137-146, e20150164. 80. He F, Guan P, Liu Q, Crabtree D, Peng L, Wang H. The relationship between obesity and body compositions with respect to the timing of puberty in Chongqing adolescents: a cross-sectional study. BMC Pub- lic Health. 2017;17:664-673. 81. Ishikawa T, Fujioka H, Ishimura T, Takenaka A, Fujisawa M. Expres- sion of leptin and leptin receptor in the testis of fertile and infertile patients. Andrologia. 2007;39(1):22-27. 82. Martins AD, Moreira AC, Sa R, et al. Leptin modulates human Sertoli cells acetate production and glycolytic profile: a novel mechanism of obesity-induced male infertility? Biochim Biophys Acta. 1852;2015: 1824-1832. 83. Morash BA, Willkinson D, Ur E, Wilkinson M. Resistin expression and regulation in mouse pituitary. FEBS Lett. 2002;526(1-3):26-30. 84. Cabrera SM, Bright GM, Frane JW, Blethen SL, Lee PA. Age of thelarche and menarche in contemporary US females: a cross- sectional analysis. Journal of pediatric endocrinology & metabolism: JPEM. 2014;27(1-2):47-51. 85. Herman-Giddens ME, Steffes J, Harris D, et al. Secondary sexual characteristics in boys: data from the Pediatric Research in Office Settings Network. Pediatrics. 2012;130(5):e1058-e1068. 86. WHO. Physical status: the use and interpretation of anthropometry. Report of a WHO Expert Committee. World Health Organ Tech Rep Ser. 1995;854:1-452. 87. Akin I, Tolg R, Hochadel M, et al. No evidence of “obesity paradox” after treatment with drug-eluting stents in a routine clinical practice: results from the prospective multicenter German DES.DE (German Drug-Eluting Stent) Registry. JACC Cardiovasc Interv. 2012;5(2): 162-169. 88. Marcovecchio ML, Chiarelli F. Obesity and growth during childhood and puberty. World Rev Nutr Diet. 2013;106:135-141. How to cite this article: Nieuwenhuis D, Pujol-Gualdo N, Arnoldussen IAC, Kiliaan AJ. Adipokines: A gear shift in puberty. Obesity Reviews. 2020;21:e13005. https://doi.org/ 10.1111/obr.13005 1467789x, 2020, 6, Downloaded from https://onlinelibrary.wiley.com/doi/10.1111/obr.13005, Wiley Online Library on [10/03/2024]. See the Terms and Conditions (https://onlinelibrary.wiley.com/terms-and-conditions) on Wiley Online Library for rules of use; OA articles are gover
GUIDELINES ON THE ESTABLISHMENT AND IMPLEMENTATION OF THE RESULTS-BASED PERFORMANCE MANAGEMENT SYSTEM IN THE DEPARTMENT OF EDUCATION I. Rationale 1. The Civil Service Commission (CSC), through the issuance of Memorandum Circular (MC) No. 06, series of 2012, sets the guidelines on the establishment and implementation of the Strategic Performance Management System (SPMS) in all government agencies. The SPMS gives emphasis to the strategic alignment of the agency’s thrusts with the day-to-day operation of the units and individual personnel within the organization. It focuses on measures of performance vis-a-vis the targeted milestones, and provides a credible and verifiable basis for assessing the organizational outcomes and the collective performance of the government employees. 2. As a learner-centered institution, the Department of Education (DepEd) is committed to continuously improve itself to better serve the Filipino learners and the community. The adoption of the SPMS in DepEd strengthens the culture of performance and accountability in the agency, with the DepEd’s mandate, vision and mission at its core. 3. There is a need to concretize the linkage between the organizational thrusts and the performance management system. It is important to ensure organizational effectiveness and track individual improvement and efficiency by cascading the institutional accountabilities to the various levels, units and individual personnel, as anchored on the establishment of a rational and factual basis for performance targets and measures. Finally, it is necessary to link the SPMS with other systems relating to human resources and to ensure adherence to the principle of performance-based tenure and incentives. 4. In view of the above, this Order aims to adopt the SPMS as the Results-based Performance Management System (RPMS). II. Scope of Policy 5. This DepEd Order provides for the establishment and implementation of the RPMS in all DepEd schools and offices, covering all officials and employees, school-based and non school-based, in the Department holding regular plantilla positions. It stipulates the specific mechanisms, criteria and processes for the performance target setting, monitoring, evaluation and development planning. IV. Policy Statement 9. The DepEd hereby sets the guidelines on the establishment and implementation of the Results-based Performance Management System (RPMS) in the Department, stipulating the strategies, methods, tools and rewards for assessing the accomplishments vis-a-vis the commitments. This will be used for measuring and rewarding higher levels of performance of the various units and development planning of all personnel in all levels. 10. For non school-based personnel, the RPMS shall provide for an objective and verifiable basis for rating and ranking the performance of units and individual personnel in view of the granting of the Performance-Based Bonus (PBB) starting 2015. 11. For school-based personnel, the RPMS shall be used only as an appraisal tool, which shall be the basis for training and development. The granting of PBB shall be governed by the existing PBB guidelines. 12. The Department shall adopt the RPMS framework shown in Annex B. 13. The DepEd RPMS shall follow the four-stage performance management system cycle as prescribed by the CSC: i. Performance planning and commitment (Phase I); ii. Performance monitoring and coaching (Phase II); iii. Performance review and evaluation (Phase III); and iv. Performance rewarding and development planning (Phase IV). V. Performance Cycle/Process 14. The RPMS shall align the performance targets and accomplishments with the Department’s mandate, vision, mission and strategic goals. It shall ensure 100% results orientation vis-a-vis the planned targets. On the other hand, the ratee’s demonstration of the required competencies shall be monitored for developmental purposes only. 15. The RPMS cycle shall cover performance for one whole year. All school-based personnel shall follow a performance cycle starting in April of the current year and ending in March of the following year; while non school-based personnel shall follow a performance cycle starting in January and ending in December. Annexes C and D illustrate the performance cycles which shall apply to school-based and non school-based personnel, respectively. 16. The performance planning and commitment shall be done prior to the beginning of the performance cycle; while the performance monitoring and coaching shall take place immediately after Phase I, and continue throughout the performance cycle. The performance review and evaluation, as well as the performance rewarding and development planning shall be done at the end of the performance cycle. A. Phase I: Performance Planning and Commitment 17. The performance planning and commitment shall be done prior to the start of the performance cycle where the rater meets with the ratee to discuss and agree on the following: i. Office KRAs, Objectives and Performance Indicators as anchored to the overall organizational outcomes; and ii. Individual KRAs, Objectives and Performance Indicators as anchored to the Office KRAs and Objectives. 18. The Office Performance Commitment and Review Form (OPCRF) shall be accomplished by the head of office to reflect the Office KRAs, Objectives and Performance Indicators. The head of office, in coordination with the Planning Office, shall ensure alignment of the office plans and commitments to the overall organizational outcomes. The OPCRF shall be equivalent to the IPCRF of the head of office. A sample of the filled out OPCRF, including the instructions for accomplishing the form, is shown in Annex E. 19. The Individual Performance Commitment and Review Form (IPCRF) shall be accomplished by the individual personnel to reflect the agreed Individual KRAs, Objectives and Performance Indicators. A sample of the filled out IPCRF, including the instructions for accomplishing the form, is shown in Annex F. 20. Defining the Key Result Areas. The head of office, in coordination with the Planning Office, shall define the office KRAs as anchored on the overall organizational outcomes. The rater and the ratee shall discuss and agree on the break down of the office KRAs into individual KRAs. Three (3) to five (5) KRAs shall be defined for each office and individual employee. KRAs are broad categories of general outputs or outcomes. It is the mandate or function of the office and/or individual employee. The KRA is the reason why an office and/or job exist. It is an area where the office and/or individual employee are expected to focus on. 21. Setting the Objectives. The head of office shall set three (3) objectives per office KRA. The rater and the ratee shall discuss and agree on three (3) objectives per individual KRA. Objectives are specific tasks, which an office and/or employee need to do to achieve their specific KRAs. In objective setting, the SMART criteria, which stands for Specific, Measurable, Attainable, Relevant, Time Bound, shall be applied. The SMART criteria are illustrated in Annex G. 22. Setting the Timeline. The timeline shall define the target date for accomplishing each of the Objectives. The timeline for the office Objectives shall be set by the head of office in coordination with the Planning Office and School Planning Team; while the timeline for the individual Objectives shall be discussed and agreed by the rater and the ratee. 23. Assigning the Weight. Assigning of weights shall be done per KRA. Weights for each office KRA shall be assigned by the head of office in coordination with the Planning Office; while the weights for each of the individual KRAs shall be discussed and agreed upon by the rater and the ratee. 24. Identifying the Performance Indicators. Using a five (5)-point rating scale, the head of office shall identify a performance indicator for each of the office objectives, while the rater and the ratee shall identify and agree on the performance indicator for each of the individual objectives. Performance indicators are exact quantification of objectives expressed through rubrics. They are assessment tools, which gauge whether a performance is positive or negative. In identifying the performance indicator, the operational definition or meaning of each numerical rating shall be indicated under each relevant dimension (i.e., quality, efficiency, or timeliness) per performance target or success indicator. This shall ensure that the rating is objective, impartial and verifiable. Table 1 below discusses the performance measures by which the indicator must satisfy. Table 1. Performance Measures CATEGORY DEFINITION Effectiveness/Quality The extent to which actual performance compares with targeted performance. The degree to which objectives are achieved and the extent to which targeted problems are solved. In management, effectiveness relates to getting the right things done. Efficiency The extent to which time or resources is used for the intended task or purpose. Measures whether targets are accomplished with a minimum amount or quantity of waste, expense, or unnecessary effort. Timeliness Measures whether the deliverable was done on time based on the requirements of the rules and regulations, and/or clients/stakeholders. Time-related performance indicators evaluate such things as project completion deadlines, time management skills and other time-sensitive expectations. Some Performances are only rated on quality and efficiency, some on quality and timeliness, and others on efficiency only. You need not use all three (3) categories. 25. Demonstration of Competencies. During Phase I, the rater shall discuss with the ratee the competencies required of the individual personnel. Competencies are defined as the knowledge, skills and behavior that individuals demonstrate in achieving one’s results. Competencies shall uphold the DepEd’s core values. They represent the way individuals define and live the values. 26. DepEd shall adopt four classes of competencies as follows: i. Core behavioral competencies are competencies, which cut across the organization; ii. Leadership competencies are competencies intended for managerial positions; a. Third level officials b. Chiefs and Assistant Chiefs c. School Heads and Department Heads iii. Staff Core Skills are competencies intended for staff and teaching-related personnel; and iv. Teaching competencies are competencies intended for teachers. The DepEd-required competencies are illustrated in Annex I. 27. The ratee’s demonstration of the required competencies shall be monitored to effectively plan the interventions needed for behavioral and professional development. The assessment in the demonstration of competencies shall not be reflected in the final rating. 28. Reaching Agreement. Once the office and individual KRAs, Objectives and Performance Indicators are clearly defined, the rater and the ratee shall commit and reach an agreement by signing the OPCRF and IPCRF. The signed/approved OPCRF and IPCRF shall be the basis for monitoring and assessment, which shall take place in Phases II and III, respectively. B. Phase II: Performance Monitoring and Coaching 29. The performance monitoring and coaching shall commence after the rater and the ratee commit on the KRAs, Objectives and Performance Indicators, and sign the OPCRF and IPCRF. This shall be done throughout the year. 30. The two (2) main components of Phase II are the following: i. Performance monitoring; and ii. Coaching and feedback. 31. Performance monitoring shall provide key inputs and objective basis for rating. It shall facilitate feedback and provide evidence of performance. Performance monitoring shall be the responsibility of both the rater and the ratee who agree to track and record significant incidents through the use of the Performance Monitoring and Coaching Form (PMCF) shown in Annex J. Significant incidents are actual events and behaviors in which both positive and negative performances are observed and documented. 32. Coaching and feedback shall be a continuous process. Coaching and feedback shall be provided by the rater and/or shall be sought by the ratee to improve work performance and behavior. The rater, as the coach or mentor of the ratee, playing a critical role in the performance monitoring and coaching, shall provide an enabling environment and intervention to improve the office performance and to manage and develop individual potentials. 33. The PMCF shall capture the significant incidents. It shall provide a record of demonstrated behaviors, competencies and performance, and shall be an effective substitute in the absence of quantifiable data. The rater and the ratee shall sign each significant incident recorded in the PMCF to ensure that agreement has been reached. C. Phase III: Performance Review and Evaluation 34. The performance review and evaluation shall be done at the end of the performance cycle to assess the office and individual employee’s performance level based on the commitments and measures as contained in the signed OPCRF and IPCRF. 35. A mid-year review is prescribed to determine the progress in achieving the Objectives. In exceptional cases, and only if the situation warrants, a one-time recalibration of office and individual Objectives shall be allowed during the mid-year review. Exceptional cases shall include instances when high level decisions are taken into effect such as changes in strategic directions, and circumstances beyond the control of the ratee such as natural and/or man-made calamities, including typhoon, earthquake and other fortuitous events. During the mid-year review, the rater shall inform in writing the ratee of the status of performance, in case of an Unsatisfactory or Poor performance. Coaching, feedback and appropriate interventions shall be provided where necessary. 36. The RPMS shall put premium on KRAs towards the realization of organizational vision, mission, strategic priorities and the OPIF logframe. Hence, rating for planned and/or intervening tasks shall always be supported by reports, documents or any output as proofs of actual performance. In the absence of said bases or proofs, a particular task shall not be rated and shall be disregarded. 37. Office and Individual Performance Assessment. The head of office, in coordination with the Planning Office, shall assess the performance of the office vis-a-vis the committed targets at the beginning of the performance cycle. The rater and the ratee shall discuss and agree on the individual assessment based on the actual accomplishments of each of the KRAs and Objectives. The final rating shall be based solely on the accomplishment of the specific objectives as measured by the Performance Indicators. The OPCRF and IPCRF shall be accomplished and completed by the rater and the ratee to: i. Reflect actual accomplishments and results; ii. Rate each of the objectives; iii. Compute for the score per objective; iv. Determine the overall rating for accomplishments; v. Reach an agreement; and vi. Assess the competencies. 38. Initial self-rating shall be encouraged prior to the rater-ratee discussion. 39. Third Level Officials, as heads of offices, shall accomplish the OPCRF for submission to the Planning Office. The individual assessment of Third Level Officials shall be contained in the CESPES Forms for submission to the Career Executive Service Board (CESB). The BHROD and Personnel Division shall be furnished a copy of both forms. 40. Actual Results. The rater and the ratee shall discuss and agree on the actual accomplishments and results based on the performance commitments and measures made at the beginning of the rating period. They shall evaluate each objective whether it has been achieved or not. The significant incidents as reflected in the PMCF shall be considered for the actual results. 41. Rating the Objectives. Based on the actual accomplishments and results, each of the Objectives shall be rated using the rating scale specified below: Table 2. The RPMS Rating Scale NUMERICAL RATING ADJECTIVAL RATING DESCRIPTION OF MEANING OF RATING 5 Outstanding Performance represents an extraordinary level of achievement and commitment in terms of quality and time, technical skills and knowledge, ingenuity, creativity and initiative. Employees at this performance level should have demonstrated exceptional job mastery in all major areas of responsibility. Employee achievement and contributions to the organization are of marked excellence. 4 Very Satisfactory Performance exceeded expectations. All goals, objectives and targets were achieved above the established standards. 3 Satisfactory Performance met expectations in terms of quality of work, efficiency and timeliness. The most critical annual goals were met. 2 Unsatisfactory Performance failed to meet expectations, and/or one or more of the most critical goals were not met. 1 Poor Performance was consistently below expectations, and/or reasonable progress toward critical goals was not made. Significant improvement is needed in one or more important areas. The final assessment shall correspond to the adjectival description of Outstanding, Very Satisfactory, Satisfactory, Unsatisfactory or Poor. The range of adjectival rating is as per attached in Forms A, B, and C. 42. Process for Computing the Score per KRA. i. The rater and ratee shall ensure that each KRA has been assigned weight according to priority. ii. As an option, the rater and ratee may assign weights to objectives which shall be equal to the total weight assigned to a particular KRA. KRA 1 – Weight assigned is 40% Objective 1 is 20% Objective 2 is 10% Objective 3 is 10% iii. The score per KRA shall be computed using the following formula: 43. Plus Factor. The plus factor shall be considered as another KRA. These are value adding accomplishments, which are not covered within the regular duties and responsibilities. The weight on the plus factor shall not exceed the weight of the highest mandated KRA. For teachers, the plus factor shall be limited to work/activities, which contribute to the teaching-learning process. 44. Determining the Overall Rating for Accomplishments. The overall rating/assessment for the accomplishments shall fall within the following adjectival ratings and shall be in three (3) decimal points: Table 3. Adjectival Ratings RANGE ADJECTIVAL RATING 4.500-5.000 Outstanding 3.500-4.499 Very Satisfactory 2.500-3.499 Satisfactory 1.500-2.499 Unsatisfactory below 1.499 Poor 45. Reaching Agreement. Upon determining the overall rating for the actual accomplishments and results, the rater and the ratee shall reach an agreement by signing the OPCRF and IPCRF. The average rating of individual staff members should not go higher than the collective performance assessment of the office. 46. Assessing the Competencies. The rater shall discuss with the ratee the set of competencies observed during the performance cycle. The competencies shall not be reflected in the final rating. Competencies shall be monitored for developmental purposes. In evaluating the individual’s demonstration of competencies, the rating scale in Table 4 shall apply: Table 4. The DepEd Competencies Scale SCALE DEFINITION 5 Role model 4 Consistently demonstrates 3 Most of the time demonstrates 2 Sometimes demonstrates 1 Rarely demonstrates 5 (role model) – all competency indicators 4 (consistently demonstrates) – four competency indicators 3 (most of the time demonstrates) – three competency indicators 2 (sometimes demonstrates) – two competency indicators 1 (rarely demonstrates) – one competency indicator D. Phase IV: Performance Rewarding and Development Planning 47. The results of the performance review and evaluation shall be used in performance rewarding and development planning. This phase shall be done after Phase III. 48. The rater shall discuss and provide qualitative comments, observations and recommendations in the individual employee’s performance commitment, competency assessment and significant incidents which shall be used for training and professional development. These can be written under the strengths and development needs column of the Part IV-Development Plans of the IPCRF. 49. The rater and the ratee shall identify and discuss the individual’s strengths and development needs, and reflect them in the Part IV-Development Plans of the IPCRF. The competencies which the ratee demonstrated consistently and the areas, where the ratee meet or exceed expectations shall be referred to as the ratee’s strengths. The competencies, which the ratee rarely demonstrates and the areas where the ratee has room for improvement and has not met the expectations, shall be identified as the ratee’s development needs. Make a situational SOLO-based questions in the context of school leadership
Introduction to Free Fall A free-falling object is an object that is falling under the sole influence of gravity. Any object that is being acted upon only by the force of gravity is said to be in a state of free fall. There are two important motion characteristics that are true of free-falling objects: • Free-falling objects do not encounter air resistance. • All free-falling objects (on Earth) accelerate downwards at a rate of 9.8 m/s/s (often approximated as 10 m/s/s for back-of-the-envelope calculations) Because free-falling objects are accelerating downwards at a rate of 9.8 m/s/s, a ticker tape trace or dot diagram of its motion would depict an acceleration. The dot diagram at the right depicts the acceleration of a free-falling object. The position of the object at regular time intervals - say, every 0.1 second - is shown. The fact that the distance that the object travels every interval of time is increasing is a sure sign that the ball is speeding up as it falls downward. Recall from an earlier lesson, that if an object travels downward and speeds up, then its acceleration is downward. Free-fall acceleration is often witnessed in a physics classroom by means of an ever-popular strobe light demonstration. The room is darkened and a jug full of water is connected by a tube to a medicine dropper. The dropper drips water and the strobe illuminate the falling droplets at a regular rate - say once every 0.2 seconds. Instead of seeing a stream of water free-falling from the medicine dropper, several consecutive drops with increasing separation distance are seen. The pattern of drops resembles the dot diagram shown in the graphic at the right. The Acceleration of Gravity It was learned in the previous part of this lesson that a free-falling object is an object that is falling under the sole influence of gravity. A free-falling object has an acceleration of 9.8 m/s/s, downward (on Earth). This numerical value for the acceleration of a free-falling object is such an important value that it is given a special name. It is known as the acceleration of gravity - the acceleration for any object moving under the sole influence of gravity. A matter of fact, this quantity known as the acceleration of gravity is such an important quantity that physicists have a special symbol to denote it - the symbol g. The numerical value for the acceleration of gravity is most accurately known as 9.8 m/s2. There are slight variations in this numerical value (to the second decimal place) that are dependent primarily upon on altitude. We will occasionally use the approximated value of 10 m/s2 in order to reduce the complexity of the many mathematical tasks that we will perform with this number. By so doing, we will be able to better focus on the conceptual nature of physics without too much of a sacrifice in numerical accuracy. g = 9.8 m/s2, downward Look It Up! Even on the surface of the Earth, there are local variations in the value of the acceleration of gravity (g). These variations are due to latitude, altitude and the local geological structure of the region. Recall from an earlier lesson that acceleration is the rate at which an object changes its velocity. It is the ratio of velocity change to time between any two points in an object's path. To accelerate at 9.8 m/s2 means to change the velocity by 9.8 m/s each second. If the velocity and time for a free-falling object being dropped from a position of rest were tabulated, then one would note the following pattern. Time (s) Velocity (m/s) 0 0 1 - 9.8 2 - 19.6 3 - 29.4 4 - 39.2 5 - 49.0 . Observe that the velocity-time data above reveal that the object's velocity is changing by 9.8 m/s each consecutive second. That is, the free-falling object has an acceleration of approximately 9.8 m/s2. Another way to represent this acceleration of 9.8 m/s2 is to add numbers to our dot diagram that we saw earlier in this lesson. The velocity of the ball is seen to increase as depicted in the diagram at the right. (NOTE: The diagram is not drawn to scale - in two seconds, the object would drop considerably further than the distance from shoulder to toes.) Representing Free Fall by Graphs • Early in Lesson 1 it was mentioned that there are a variety of means of describing the motion of objects. One such means of describing the motion of objects is through the use of graphs - position versus time and velocity vs. time graphs. In this part of Lesson 5, the motion of a free-falling motion will be represented using these two basic types of graphs. Representing Free Fall by Position-Time Graphs A position versus time graph for a free-falling object is shown below. Observe that the line on the graph curves. As learned earlier, a curved line on a position versus time graph signifies an accelerated motion. Since a free-falling object is undergoing an acceleration (g = 9.8 m/s/s), it would be expected that its position-time graph would be curved. A further look at the position-time graph reveals that the object starts with a small velocity (slow) and finishes with a large velocity (fast). Since the slope of any position vs. time graph is the velocity of the object (as learned in Lesson 3), the small initial slope indicates a small initial velocity and the large final slope indicates a large final velocity. Finally, the negative slope of the line indicates a negative (i.e., downward) velocity. Representing Free Fall by Velocity-Time Graphs A velocity versus time graph for a free-falling object is shown below. Observe that the line on the graph is a straight, diagonal line. As learned earlier, a diagonal line on a velocity versus time graph signifies an accelerated motion. Since a free-falling object is undergoing an acceleration (g = 9,8 m/s/s, downward), it would be expected that its velocity-time graph would be diagonal. A further look at the velocity-time graph reveals that the object starts with a zero velocity (as read from the graph) and finishes with a large, negative velocity; that is, the object is moving in the negative direction and speeding up. An object that is moving in the negative direction and speeding up is said to have a negative acceleration (if necessary, review the vector nature of acceleration). Since the slope of any velocity versus time graph is the acceleration of the object (as learned in Lesson 4), the constant, negative slope indicates a constant, negative acceleration. This analysis of the slope on the graph is consistent with the motion of a free-falling object - an object moving with a constant acceleration of 9.8 m/s/s in the downward direction. The Kinematic Equations The goal of this first unit has been to investigate the variety of means by which the motion of objects can be described. The variety of representations that we have investigated includes verbal representations, pictorial representations, numerical representations, and graphical representations (position-time graphs and velocity-time graphs). In Lesson 6, we will investigate the use of equations to describe and represent the motion of objects. These equations are known as kinematic equations. There are a variety of quantities associated with the motion of objects - displacement (and distance), velocity (and speed), acceleration, and time. Knowledge of each of these quantities provides descriptive information about an object's motion. For example, if a car is known to move with a constant velocity of 22.0 m/s, North for 12.0 seconds for a northward displacement of 264 meters, then the motion of the car is fully described. And if a second car is known to accelerate from a rest position with an eastward acceleration of 3.0 m/s2 for a time of 8.0 seconds, providing a final velocity of 24 m/s, East and an eastward displacement of 96 meters, then the motion of this car is fully described. These two statements provide a complete description of the motion of an object. However, such completeness is not always known. It is often the case that only a few parameters of an object's motion are known, while the rest are unknown. For example as you approach the stoplight, you might know that your car has a velocity of 22 m/s, East and is capable of a skidding acceleration of 8.0 m/s2, West. However you do not know the displacement that your car would experience if you were to slam on your brakes and skid to a stop; and you do not know the time required to skid to a stop. In such an instance as this, the unknown parameters can be determined using physics principles and mathematical equations (the kinematic equations). The BIG 4 The kinematic equations are a set of four equations that can be utilized to predict unknown information about an object's motion if other information is known. The equations can be utilized for any motion that can be described as being either a constant velocity motion (an acceleration of 0 m/s/s) or a constant acceleration motion. They can never be used over any time period during which the acceleration is changing. Each of the kinematic equations include four variables. If the values of three of the four variables are known, then the value of the fourth variable can be calculated. In this manner, the kinematic equations provide a useful means of predicting information about an object's motion if other information is known. For example, if the acceleration value and the initial and final velocity values of a skidding car is known, then the displacement of the car and the time can be predicted using the kinematic equations. Lesson 6 of this unit will focus upon the use of the kinematic equations to predict the numerical values of unknown quantities for an object's motion. The four kinematic equations that describe an object's motion are: There are a variety of symbols used in the above equations. Each symbol has its own specific meaning. The symbol d stands for the displacement of the object. The symbol t stands for the time for which the object moved. The symbol a stands for the acceleration of the object. And the symbol v stands for the velocity of the object; a subscript of i after the v (as in vi) indicates that the velocity value is the initial velocity value and a subscript of f (as in vf) indicates that the velocity value is the final velocity value. Each of these four equations appropriately describes the mathematical relationship between the parameters of an object's motion. As such, they can be used to predict unknown information about an object's motion if other information is known. In the next part of Lesson 6 we will investigate the process of doing this. Kinematic Equations and Problem-Solving The four kinematic equations that describe the mathematical relationship between the parameters that describe an object's motion were introduced in the previous part of Lesson 6. The four kinematic equations are: In the above equations, the symbol d stands for the displacement of the object. The symbol t stands for the time for which the object moved. The symbol a stand for the acceleration of the object. And the symbol v stands for the instantaneous velocity of the object; a subscript of i after the v (as in vi) indicates that the velocity value is the initial velocity value and a subscript of f (as in vf) indicates that the velocity value is the final velocity value. Problem-Solving Strategy In this part of Lesson 6 we will investigate the process of using the equations to determine unknown information about an object's motion. The process involves the use of a problem-solving strategy that will be used throughout the course. The strategy involves the following steps: 1. Construct an informative diagram of the physical situation. 2. Identify and list the given information in variable form. 3. Identify and list the unknown information in variable form. 4. Identify and list the equation that will be used to determine unknown information from known information. 5. Substitute known values into the equation and use appropriate algebraic steps to solve for the unknown information. 6. Check your answer to ensure that it is reasonable and mathematically correct. The use of this problem-solving strategy in the solution of the following problem is modeled in Examples A and B below. Example Problem A . Ima Hurryin is approaching a stoplight moving with a velocity of +30.0 m/s. The light turns yellow, and Ima applies the brakes and skids to a stop. If Ima's acceleration is -8.00 m/s2, then determine the displacement of the car during the skidding process. (Note that the direction of the velocity and the acceleration vectors are denoted by a + and a - sign.) The solution to this problem begins by the construction of an informative diagram of the physical situation. This is shown below. The second step involves the identification and listing of known information in variable form. Note that the vf value can be inferred to be 0 m/s since Ima's car comes to a stop. The initial velocity (vi) of the car is +30.0 m/s since this is the velocity at the beginning of the motion (the skidding motion). And the acceleration (a) of the car is given as - 8.00 m/s2. (Always pay careful attention to the + and - signs for the given quantities.) The next step of the strategy involves the listing of the unknown (or desired) information in variable form. In this case, the problem requests information about the displacement of the car. So d is the unknown quantity. The results of the first three steps are shown in the table below. Diagram: Given: Find: vi = +30.0 m/s vf = 0 m/s a = - 8.00 m/s2 d = ?? The next step of the strategy involves identifying a kinematic equation that would allow you to determine the unknown quantity. There are four kinematic equations to choose from. In general, you will always choose the equation that contains the three known and the one unknown variable. In this specific case, the three known variables and the one unknown variable are vf, vi, a, and d. Thus, you will look for an equation that has these four variables listed in it. An inspection of the four equations above reveals that the equation on the top right contains all four variables. vf2 = vi2 + 2 • a • d Once the equation is identified and written down, the next step of the strategy involves substituting known values into the equation and using proper algebraic steps to solve for the unknown information. This step is shown below. (0 m/s)2 = (30.0 m/s)2 + 2 • (-8.00 m/s2) • d 0 m2/s2 = 900 m2/s2 + (-16.0 m/s2) • d (16.0 m/s2) • d = 900 m2/s2 - 0 m2/s2 (16.0 m/s2)*d = 900 m2/s2 d = (900 m2/s2)/ (16.0 m/s2) d = (900 m2/s2)/ (16.0 m/s2) d = 56.3 m The solution above reveals that the car will skid a distance of 56.3 meters. (Note that this value is rounded to the third digit.) The last step of the problem-solving strategy involves checking the answer to assure that it is both reasonable and accurate. The value seems reasonable enough. It takes a car a considerable distance to skid from 30.0 m/s (approximately 65 mi/hr) to a stop. The calculated distance is approximately one-half a football field, making this a very reasonable skidding distance. Checking for accuracy involves substituting the calculated value back into the equation for displacement and insuring that the left side of the equation is equal to the right side of the equation. Indeed it is! Example Problem B Ben Rushin is waiting at a stoplight. When it finally turns green, Ben accelerated from rest at a rate of a 6.00 m/s2 for a time of 4.10 seconds. Determine the displacement of Ben's car during this time period. Once more, the solution to this problem begins by the construction of an informative diagram of the physical situation. This is shown below. The second step of the strategy involves the identification and listing of known information in variable form. Note that the vi value can be inferred to be 0 m/s since Ben's car is initially at rest. The acceleration (a) of the car is 6.00 m/s2. And the time (t) is given as 4.10 s. The next step of the strategy involves the listing of the unknown (or desired) information in variable form. In this case, the problem requests information about the displacement of the car. So d is the unknown information. The results of the first three steps are shown in the table below. Diagram: Given: Find: vi = 0 m/s t = 4.10 s a = 6.00 m/s2 d = ?? The next step of the strategy involves identifying a kinematic equation that would allow you to determine the unknown quantity. There are four kinematic equations to choose from. Again, you will always search for an equation that contains the three known variables and the one unknown variable. In this specific case, the three known variables and the one unknown variable are t, vi, a, and d. An inspection of the four equations above reveals that the equation on the top left contains all four variables. d = vi • t + ½ • a • t2 Once the equation is identified and written down, the next step of the strategy involves substituting known values into the equation and using proper algebraic steps to solve for the unknown information. This step is shown below. d = (0 m/s) • (4.1 s) + ½ • (6.00 m/s2) • (4.10 s)2 d = (0 m) + ½ • (6.00 m/s2) • (16.81 s2) d = 0 m + 50.43 m d = 50.4 m The solution above reveals that the car will travel a distance of 50.4 meters. (Note that this value is rounded to the third digit.) The last step of the problem-solving strategy involves checking the answer to assure that it is both reasonable and accurate. The value seems reasonable enough. A car with an acceleration of 6.00 m/s/s will reach a speed of approximately 24 m/s (approximately 50 mi/hr) in 4.10 s. The distance over which such a car would be displaced during this time period would be approximately one-half a football field, making this a very reasonable distance. Checking for accuracy involves substituting the calculated value back into the equation for displacement and insuring that the left side of the equation is equal to the right side of the equation. Indeed, it is! The two example problems above illustrate how the kinematic equations can be combined with a simple problem-solving strategy to predict unknown motion parameters for a moving object. Provided that three motion parameters are known, any of the remaining values can be determined. In the next part of Lesson 6, we will see how this strategy can be applied to free fall situations. Or if interested, you can try some practice problems and check your answer against the given solutions. Kinematic Equations and Free Fall As mentioned in Lesson 5, a free-falling object is an object that is falling under the sole influence of gravity. That is to say that any object that is moving and being acted upon only be the force of gravity is said to be "in a state of free fall." Such an object will experience a downward acceleration of 9.8 m/s/s. Whether the object is falling downward or rising upward towards its peak, if it is under the sole influence of gravity, then its acceleration value is 9.8 m/s/s. Like any moving object, the motion of an object in free fall can be described by four kinematic equations. The kinematic equations that describe any object's motion are: The symbols in the above equation have a specific meaning: the symbol d stands for the displacement; the symbol t stands for the time; the symbol a stands for the acceleration of the object; the symbol vi stands for the initial velocity value; and the symbol vf stands for the final velocity. Applying Free Fall Concepts to Problem-Solving There are a few conceptual characteristics of free fall motion that will be of value when using the equations to analyze free fall motion. These concepts are described as follows: • An object in free fall experiences an acceleration of -9.8 m/s/s. (The - sign indicates a downward acceleration.) Whether explicitly stated or not, the value of the acceleration in the kinematic equations is -9.8 m/s/s for any freely falling object. • If an object is merely dropped (as opposed to being thrown) from an elevated height, then the initial velocity of the object is 0 m/s. • If an object is projected upwards in a perfectly vertical direction, then it will slow down as it rises upward. The instant at which it reaches the peak of its trajectory, its velocity is 0 m/s. This value can be used as one of the motion parameters in the kinematic equations; for example, the final velocity (vf) after traveling to the peak would be assigned a value of 0 m/s. • If an object is projected upwards in a perfectly vertical direction, then the velocity at which it is projected is equal in magnitude and opposite in sign to the velocity that it has when it returns to the same height. That is, a ball projected vertically with an upward velocity of +30 m/s will have a downward velocity of -30 m/s when it returns to the same height. These four principles and the four kinematic equations can be combined to solve problems involving the motion of free-falling objects. The two examples below illustrate application of free fall principles to kinematic problem-solving. In each example, the problem solving strategy that was introduced earlier in this lesson will be utilized. Example Problem A Luke Autbeloe drops a pile of roof shingles from the top of a roof located 8.52 meters above the ground. Determine the time required for the shingles to reach the ground. The solution to this problem begins by the construction of an informative diagram of the physical situation. This is shown below. The second step involves the identification and listing of known information in variable form. You might note that in the statement of the problem, there is only one piece of numerical information explicitly stated: 8.52 meters. The displacement (d) of the shingles is -8.52 m. (The - sign indicates that the displacement is downward). The remaining information must be extracted from the problem statement based upon your understanding of the above principles. For example, the vi value can be inferred to be 0 m/s since the shingles are dropped (released from rest; see note above). And the acceleration (a) of the shingles can be inferred to be -9.8 m/s2 since the shingles are free-falling (see note above). (Always pay careful attention to the + and - signs for the given quantities.) The next step of the solution involves the listing of the unknown (or desired) information in variable form. In this case, the problem requests information about the time of fall. So t is the unknown quantity. The results of the first three steps are shown in the table below. Diagram: Given: Find: vi = 0.0 m/s d = -8.52 m a = - 9.8 m/s2 t = ?? The next step involves identifying a kinematic equation that allows you to determine the unknown quantity. There are four kinematic equations to choose from. In general, you will always choose the equation that contains the three known and the one unknown variable. In this specific case, the three known variables and the one unknown variable are d, vi, a, and t. Thus, you will look for an equation that has these four variables listed in it. An inspection of the four equations above reveals that the equation on the top left contains all four variables. d = vi • t + ½ • a • t2 Once the equation is identified and written down, the next step involves substituting known values into the equation and using proper algebraic steps to solve for the unknown information. This step is shown below. -8.52 m = (0 m/s) • (t) + ½ • (-9.8 m/s2) • (t)2 -8.52 m = (0 m) *(t) + (-4.9 m/s2) • (t)2 -8.52 m = (-4.9 m/s2) • (t)2 (-8.52 m)/(-4.9 m/s2) = t2 1.739 s2 = t2 t = 1.32 s The solution above reveals that the shingles will fall for a time of 1.32 seconds before hitting the ground. (Note that this value is rounded to the third digit.) The last step of the problem-solving strategy involves checking the answer to assure that it is both reasonable and accurate. The value seems reasonable enough. The shingles are falling a distance of approximately 10 yards (1 meter is pretty close to 1 yard); it seems that an answer between 1 and 2 seconds would be highly reasonable. The calculated time easily falls within this range of reasonability. Checking for accuracy involves substituting the calculated value back into the equation for time and insuring that the left side of the equation is equal to the right side of the equation. Indeed it is! Example Problem B Rex Things throws his mother's crystal vase vertically upwards with an initial velocity of 26.2 m/s. Determine the height to which the vase will rise above its initial height. Once more, the solution to this problem begins by the construction of an informative diagram of the physical situation. This is shown below. The second step involves the identification and listing of known information in variable form. You might note that in the statement of the problem, there is only one piece of numerical information explicitly stated: 26.2 m/s. The initial velocity (vi) of the vase is +26.2 m/s. (The + sign indicates that the initial velocity is an upwards velocity). The remaining information must be extracted from the problem statement based upon your understanding of the above principles. Note that the vf value can be inferred to be 0 m/s since the final state of the vase is the peak of its trajectory (see note above). The acceleration (a) of the vase is -9.8 m/s2 (see note above). The next step involves the listing of the unknown (or desired) information in variable form. In this case, the problem requests information about the displacement of the vase (the height to which it rises above its starting height). So d is the unknown information. The results of the first three steps are shown in the table below. Diagram: Given: Find: vi = 26.2 m/s vf = 0 m/s a = -9.8 m/s2 d = ?? The next step involves identifying a kinematic equation that would allow you to determine the unknown quantity. There are four kinematic equations to choose from. Again, you will always search for an equation that contains the three known variables and the one unknown variable. In this specific case, the three known variables and the one unknown variable are vi, vf, a, and d. An inspection of the four equations above reveals that the equation on the top right contains all four variables. vf2 = vi2 + 2 • a • d Once the equation is identified and written down, the next step involves substituting known values into the equation and using proper algebraic steps to solve for the unknown information. This step is shown below. (0 m/s)2 = (26.2 m/s)2 + 2 •(-9.8m/s2) •d 0 m2/s2 = 686.44 m2/s2 + (-19.6 m/s2) •d (-19.6 m/s2) • d = 0 m2/s2 -686.44 m2/s2 (-19.6 m/s2) • d = -686.44 m2/s2 d = (-686.44 m2/s2)/ (-19.6 m/s2) d = 35.0 m The solution above reveals that the vase will travel upwards for a displacement of 35.0 meters before reaching its peak. (Note that this value is rounded to the third digit.) The last step of the problem-solving strategy involves checking the answer to assure that it is both reasonable and accurate. The value seems reasonable enough. The vase is thrown with a speed of approximately 50 mi/hr (merely approximate 1 m/s to be equivalent to 2 mi/hr). Such a throw will never make it further than one football field in height (approximately 100 m), yet will surely make it past the 10-yard line (approximately 10 meters). The calculated answer certainly falls within this range of reasonability. Checking for accuracy involves substituting the calculated value back into the equation for displacement and insuring that the left side of the equation is equal to the right side of the equation. Indeed, it is! Kinematic equations provide a useful means of determining the value of an unknown motion parameter if three motion parameters are known. In the case of a free-fall motion, the acceleration is often known. And in many cases, another motion parameter can be inferred through a solid knowledge of some basic kinematic principles.
Lipids are large, nonpolar organic molecules. They do not dissolve in water. Lipids include triglycerides (trie-GLIS-uhr-IEDZ), phospho- lipids, steroids, waxes, and pigments. Lipid molecules have a higher ratio of carbon and hydrogen atoms to oxygen atoms than carbohydrates have. Because lipid molecules have larger numbers of carbon-hydrogen bonds per gram than other organic com- pounds do, they store more energy per gram. Fatty Acids Fatty acids are unbranched carbon chains that make up most lipids. Figure 3-10 shows that a fatty acid contains a long carbon chain (from 12 to 28 carbons) with a carboxyl group, —COOH, attached at one end. The two ends of the fatty-acid molecule have different properties. The carboxyl end is polar and is thus hydrophilic or attracted to water molecules. In contrast, the hydro- carbon end of the fatty-acid molecule is nonpolar. This end tends not to interact with water molecules and is said to be hydrophobic (HIE-droh-FOH-bik), or “water fearing.” In saturated fatty acids, such as palmitic acid, which is shown in Figure 3-10, each carbon atom is covalently bonded to four atoms. The carbon atoms are in effect full, or saturated. In contrast, linoleic acid, also shown in Figure 3-10, has carbon atoms that are not bonded to the maximum number of atoms to which they can bond. Instead, they have formed double bonds within the carbon chain. This type of fatty acid is said to be unsaturated. Triglycerides Three classes of lipids important to living things contain fatty acids: triglycerides (fats), phospholipids, and waxes. A triglyceride is composed of three molecules of fatty acid joined to one molecule of the alcohol glycerol. Saturated triglycerides are composed of saturated fatty acids. They typically have high melting points and tend to be hard at room temperature. Common dietary saturated triglycerides include butter and fats in red meat. In contrast, unsaturated triglycerides are composed of unsaturated fatty acids and are usually soft or liquid at room temperature. Unsaturated triglycerides are found primarily in plant seeds where they serve as an energy and carbon source for germinating plants. Phospholipids Phospholipids have two, rather than three, fatty acids attached to a molecule of glycerol. They have a phosphate group attached to the third carbon of the glycerol. As shown in Figure 3-11, the cell membrane is made of two layers of phospholipids, called the lipid bilayer. The inability of lipids to dissolve in water allows the mem- brane to form a barrier between the inside and outside of the cell. Hydrophilic “head” Phospholipids Hydrophobic “tail” Phospholipids Water Water The lipid bilayer of a cell membrane is a double row of phospholipids.The “tails” face each other.The “head” of a phospholipid, which contains a phosphate group, is polar and hydrophilic.The two tails are two fatty acids and are nonpolar and hydrophobic. FIGURE 3-11 H C H C O OH H C H H C H H C H H C H H C H H C H H C H H C H H C H H C H H C H H C H C H H H H C H H C H H C H H C H H C H C O OH H C H H C H H C H C H C H C H H C H H C H C H H C H H C H C H H H H C H Fatty acids have a polar carboxyl head, highlighted in purple, and a nonpolar hydrocarbon tail, highlighted in green. FIGURE 3-10 Palmitic acid Linoleic acid mb06se_bchs02.qxd 5/18/07 10:49 AM Page 59 60 CHAPTER 3 1. Compare the structure of monosaccharides, dis- accharides, and polysaccharides. 2. How are proteins constructed from amino acids? 3. How do amino acids differ from one another? 4. Describe a model of enzyme action. 5. Why do phospholipids orient in a bilayer when in a watery environment, such as a cell? 6. Describe how the three major types of lipids differ in structure from one another. 7. What are the functions of the two types of nucleic acids? CRITICAL THINKING 8. Applying Information Before a long race, run- ners often “carbo load.” This means that they eat substantial quantities of carbohydrates. How might this help their performance? 9. Recognizing Relationships High temperatures can weaken bonds within a protein molecule. How might this explain the effects of using a hot curling iron or rollers in one’s hair? 10. Applying Information You want to eat more unsaturated than saturated fats. Name examples of foods you would eat more of and less of. SECTION 2 REVIEW Waxes A wax is a type of structural lipid consisting of a long fatty-acid chain joined to a long alcohol chain. Waxes are waterproof, and in plants, form a protective coating on the outer surfaces. Waxes also form protective layers in animals. For example, earwax helps pre- vent microorganisms from entering the ear canal. Steroids Unlike most other lipids, which are composed of fatty acids, steroid molecules are composed of four fused carbon rings with various functional groups attached to them. Many animal hor- mones, such as the male hormone testosterone, are steroid com- pounds. One of the most familiar steroids in humans is cholesterol. Cholesterol is needed by the body for nerve and other cells to func- tion normally. It is also a component of the cell membrane. NUCLEIC ACIDS Nucleic acids are very large and complex organic molecules that store and transfer important information in the cell. There are two major types of nucleic acids: deoxyribonucleic acid and ribonucleic acid. Deoxyribonucleic acid, or DNA, contains information that deter- mines the characteristics of an organism and directs its cell activi- ties. Ribonucleic (RIE-boh-noo-KLEE-ik) acid, or RNA, stores and transfers information from DNA that is essential for the manufactur- ing of proteins. Some RNA molecules can also act as enzymes. Both DNA and RNA are polymers, composed of thousands of linked monomers called nucleotides (NOO-klee-uh-TIEDS). As shown in Figure 3- 12, each nucleotide is made of three main components: a phosphate group, a five-carbon sugar, and a ring-shaped nitrogenous base.
Order of Operations REVIEW before Rationals
Chapter 7 - Review Data and Decision Making *Glow bus due at midnight, name and student number: answer questions using content in class People have created wonderful things for centuries, and management Management can be traced as far back as 500 bc when the ancient Sumerians used written records to improve government and business activities Why is it important to lean from the past Not to repeat our mistakes Classical management approaches Scientific management Administrative Principles Bureaucratic organisation Behavioural Management Approaches Follett’s Organizations as communities The Hawthorne studies Maslow’s theory of human needs Mcgregor’s Theory x and Theory Y Argyris Personality and organisation Modern Management foundations Organises as systems Contingency thinking Quality management Quantitative and analysis and tools Evidence-based management Contributions Frederick Taylor - Father of Scientific management He noticed that workers often did their jobs with wasted motions and without a constant approach. His resulted in inefficiency and low performance He believed the problem could be fixed if workers were taught to do their jobs in the best ways and ten were helped and guided by supervisors Four guiding principles of scientific management Rules of motion, standardized work and proper working conditions Select workers with the right abilities Train workers and give them incentives Support workers by planning and smoothing the way as they do their work Frank and Lillian Gilbreth Pioneered use of motitono studies as a management tool In one famous case, the gilbreaths cut down the number of motions used by bricklayers adn tripled their productivity Contributions from scientific management Make results-based compensation a performance incentive Carefully design jobs with efficient work methods Carefully select workers with the ability to perform the job Trian workers to execute activities to the best of their abilities Train supervisors to support workers so they can perform jobs to the best of their abilities Classical Management Adiminstative principle (Henro Fayol) 1919, after a career in French industry, Henri F published “adminisration Industrielle et Generale” (General and industrial management) in which we out like his views on the management of organiztion and workers Rules and duties in management Foresight - to complete a plan of action for the future Organization - To provide and mobilize resources to implement the plan Common- to lead, select and evaluate workers to get the best work toward the plan Coordination- to fit diverse efforts together and ensure information is shared and problems solved Control- to make sure things happen according to plan and to take necessary corrective action Classical management Bureacratic organiztion (Max Weber) Max weber (Bureaucrativ organization) - late 19th century German political economist who had a major impact in the fields of management and sociology Bureaucratic Organization An ideal, intentionally rational adn very efficient form of organization Based on the principles of logic, order and legitimate authority Characteristics of BO Clear division of labour Clear hierarchy of authority Formal rules and procedure Impersonality Careers based on merit What are some disadvantages of bureaucracy Takes a long time for problems to become solved bec there are procedures and there is a chain of people in command Having the power Rules have to follow Excessive paperwork or “red tape” Slowness in handling problems Rigidity in the face of shifting needs Resistance to change Employee apathy Behavioural Management Approaches (focus on understanding the elements that affect human behaviour in organisations) Follett’s Organizations as communites Mary park follett contributed to the transition from classical thinking inot behavioural management Groups and human cooperation Groups allow individuales too combine their talents for a greater good Organizations are cooperating “communites” of managers adn workers Managers job is to help people copperate and achive an integration of goals and intrests Forward-looking managment insight: Making every emploee an owner creates a sense of collective responsibility Prescursor of employrr ownership, profit sharing and gain sharing Buniess problems invovle a varity of inter realted factors Prescursor of systems thinking Private profits realtive to public good Precursor of managerial ethics and social respinsibility Hawthorne studies Took place at western electric chicago plan, a tran led by Harvards Elton Mayo set out to learn how econmic incentives and workplace conditions affected workers output Maing objective Intial study examined how ecomoin incentives adn physical conditions affected worker output (productivity) No consistent relationship found During experientmetn they had 2 groups The expertiant groups (impoved wokring ocnditions ) The control group ( no changes to original working conidtions) No consitant relationship found, perfomance in both groups increased even after removing incentives Social setting and human relations Concluded New “social setting” led workers to do good job Good “Human relations” = higher productivity The contect - The Great Depression (1929-1940) Employee attitudes and groups processes Osme thinsf satisifed some workers but not others People resticited output to adhere to groups norms (Avoid layoffs) Lessons from he hawthrone stufirs Social and human concerns are keys to prductivity Hawthrone effect - People who are singled out for special attention perform as expected Maslow’s Theory of human needs Human needs The work of psychologist Abraham Maslow in the area if human “needs,” also has had a major impact in the behavioual apporach to management Maslow’s hierarchy of human needs Self actualization needs Higherst level: need foe self fulfillment to grow and use abilites to fullest and most creative extent Esteem needs Needs fro esteem in eyes of others need for respect, prestige, recognition; need for self esteem, personal sense of competence, mastery Social needs Need for love, affection, sense of belongingness in ones relationship either other people Safett needs Need for security, protection and stability in teh events of day to day life Physiological needs Most basic of all human needs: need for biological maintence; food, water and phydical well being Principles Defict principle: A satidifed need is not a motivator of behaviour Progress principles: A need becomes a motivator once the preceding lower-level need is satisfied Both principles cease to operate at self actulilzation level McGregor’s Theories Thepry x assumes that workers; Dislike work Lack ambition Are irresponsible Resist change Prefer to be led Theoyry y assumes that workers are Willing to work Willing to accept responsibility Capable of self control Capable of self direction Imaginative and creative According to McGregor, Managers create: Self fulfilling prophecies Implications of Theory x and y Theory x managers: Create situations where workers become dependent, passive and reluctant Theory y managers create situations where workers respond with initiative and high performance Central to notions of empowerment and self management Argyris’s theory of adult personality Classical management principles and practices inhibit worker maturation and are inconsistent with the mature adult personality Management practices should accommodate the mature personality: Increasing task responsibility Increasing task variety Using participative decision making Modern Management Foundation Quantitative analysis and Tools Analytics: the use of large data bases and mathematics to solve problems and make informed decision using systematic analysis Organization as systems System Collection of interrelated parts that function together to achieve a common purpose Subsystem A smaller component of a larger system Open systems Organisations that interact with their environment Contingency thinking Tires to maths managerial responses with problem (situation) No “one best way” to manage The “appropriate way to to manage depends on the situations Quality management Qality anc competitive advantafe are linked Total quality managment (TQM) Comprehensive approach to contiou impovment on teh entire organization ISO certification Gloval quality management standards Refine and upgrade quality to meet ISO requirments Evidednce Based Managment Making management decision on “hard facts” about what really works