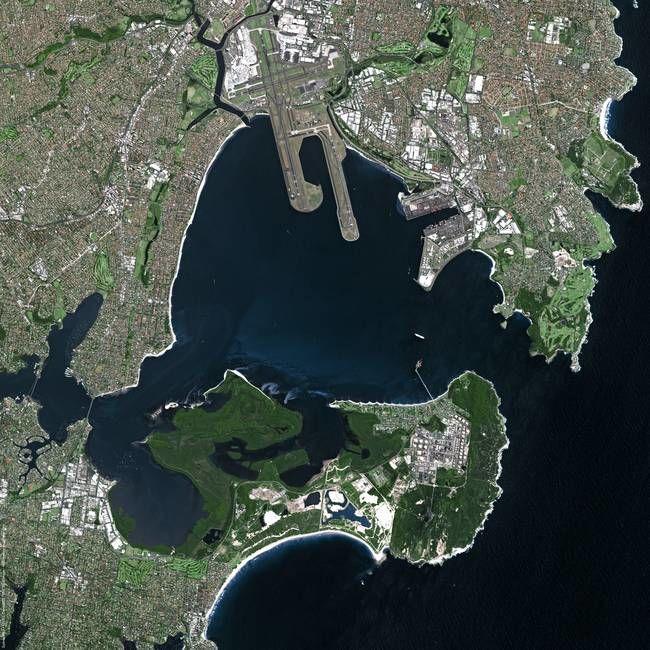
Satellite views and Topo Maps
Quiz by Ciara West
Grade 8
Science (2010) (Archived)
Texas Essential Knowledge and Skills (TEKS)
Feel free to use or edit a copy
includes Teacher and Student dashboards
Measure skillsfrom any curriculum
Measure skills
from any curriculum
Tag the questions with any skills you have. Your dashboard will track each student's mastery of each skill.
With a free account, teachers can
- edit the questions
- save a copy for later
- start a class game
- automatically assign follow-up activities based on students’ scores
- assign as homework
- share a link with colleagues
- print as a bubble sheet
9 questions
Show answers
- Q1The image shown is the coastline of Sydney, Australia. What is likely responsible for the erosion of the coastline?Rain from directly off the coastWater from the ocean wavesWind currents produced by the oceanA glacier that carries away sediment30s
- Q2In the image shown, there are large hills of sand, called sand dunes. Sand dunes are always changing shape and location. What is the most likely cause for the change of sand dunes?Erosion by waterErosion by windErosion by hurricaneErosion by glacier30s
- Q3The following image shows a crater caused by a meteor. Over time, the crater will likely change in some ways. In what ways might the crater change as time goes on?The crater will not change over time unless it gets hit by another meteor.The crater will turn into a lake over time as it rains.The crater will increase in size and weathering and erosion break down and carry sediment away from the crater.The crater will decrease in size and weathering and erosion break down and carry sediment into from the crater.30s
- Q4A student wants to draw a topographic map of the Franklin Mountains in Texas. If the student is drawing a topographic map of a mountain, how should they illustrate the mountain's steepness?They will need to draw their contour intervals closer together where the mountain is more flat, and further apart where the mountain is steeper.You cannot illustrate steepness using a topographic map.They will need to draw their contour intervals closer together where the mountain is steeper, and further apart where the mountain is more flat.They will need to draw a map with thicker lines meaning the mountain is steeper and thinner lines where the mountain is more flat.30s
- Q5Which letter labels the steepest part of the map?NML30s
- Q6What is the difference in elevation between M and L?60 meters20 meters40 meters10 meters30s
- Q7What is the contour interval of the map shown?100102005030s
- Q8What is the difference in elevation between X and Y?100 meters160 meters80 meters50 meters30s
- Q9Which of these locations are at the same elevation?C and D onlyC and EF and GC, D, H30s
