Loading...
Tag the questions with any skills you have. Your dashboard will track each student's mastery of each skill.
Which of the following statements about the graph is true?
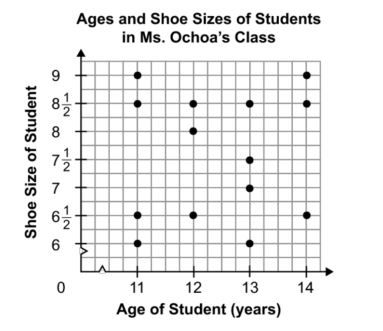
The graph shows no trend.
The graph shows a negative trend.
The graph shows a constant trend
The graph shows a positive trend.
Which of the equations below best represents the line with the following points?
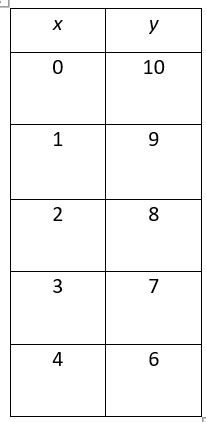
y = -x -10
y = x + 10
y = x -10
y = -x +10
Which of the following statements about the graph is true?

Which of the equations below best represents the line with the following points?

Does the data set have a positive, a negative, or no correlation?
The number of hours a plane is in flight and the number of miles flown.
Does the data set have a positive, a negative, or no correlation?
The number of hours in flight and the gallons of fuel remaining
What is the equation of the line of best fit on the scatter plot below?

What is the slope of the line that goes through points (3, 4) and (5, 2)?
What is the slope of the line that goes through points (-2, -1) and (4, 3)?
What is the approximate slope of the best fit line below?

On the scatter plot shown, what is the equation of the line of best fit?

The scatter plot below shows the numbers of customers in a restaurant for four hours of the dinner service on two different Saturday nights. The line shown models this relationship,
and x = 0 represents 7:00 p.m.
Which equation matches the best fit line below?

The scatter plot below shows the numbers of customers in a restaurant for four hours of the dinner service on two different Saturday nights. The line shown models this relationship,
and x = 0 represents 7:00 p.m.
What is the meaning of the y-intercept?

The scatter plot below shows the numbers of customers in a restaurant for four hours of the dinner service on two different Saturday nights. The line shown models this relationship,
and x = 0 represents 7:00 p.m.
What does the slope of the best fit line below represent?

What is the slope of the equation 3y = -9x + 12?
