Tag the questions with any skills you have. Your dashboard will track each student's mastery of each skill.
Give this quiz to my class
Q 1/12
Score 0
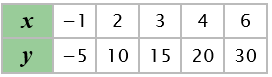
Which of these statements is false?
30
The data in the table represent a non-proportional relationship.
The data in the table represent a proportional linear relationship.
According to the data in the table, y varies directly with x.
The data in the table represent a linear relationship.
Q 2/12
Score 0
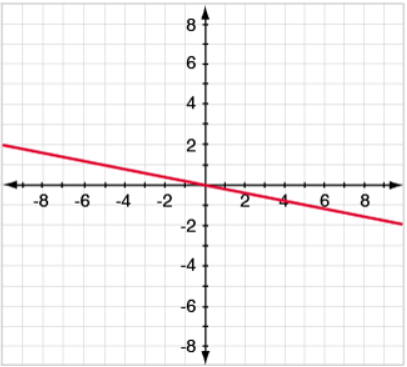
What is the slope of the line on the graph?
30
5/1
-1/5
-5/1
1/5
12 questions
Q.
Which of these statements is false?
1
30 sec
Q.
What is the slope of the line on the graph?
2
30 sec
Q.
Marta has opened a savings account with $25. At the end of three months, she has $85 in her account. She deposited the same amount each month during these three months. At what rate has she been making deposits to her savings?
3
30 sec
Q.
Write a function rule that represents the data.
4
30 sec
Q.
Write a function rule that represents this data.
5
30 sec
Q.
A line passes through the points (-2,-1) and (4,2). What is the slope of the line?
6
30 sec
Q.
Write a function rule that describes the graph.
7
30 sec
Q.
What does the slope of the graph represent?
8
30 sec
Q.
The price to travel in a taxi in a certain large city costs $2.50 for the initial fare and $0.50 per mile. The cost to ride in a town car in the same city is $3 per mile. Which of the following is true?
9
30 sec
Q.
What is the slope of this line? y = 4/3x - 12
10
30 sec
Q.
What is the y-intercept of the line? y = -0.1x
11
30 sec
Q.
Which is NOT a way to tell if a graph is proportional?