

SLOPE Review
Quiz by Ramona Vedia
Feel free to use or edit a copy
includes Teacher and Student dashboards
Measure skillsfrom any curriculum
Measure skills
from any curriculum
Tag the questions with any skills you have. Your dashboard will track each student's mastery of each skill.
With a free account, teachers can
- edit the questions
- save a copy for later
- start a class game
- automatically assign follow-up activities based on students’ scores
- assign as homework
- share a link with colleagues
- print as a bubble sheet
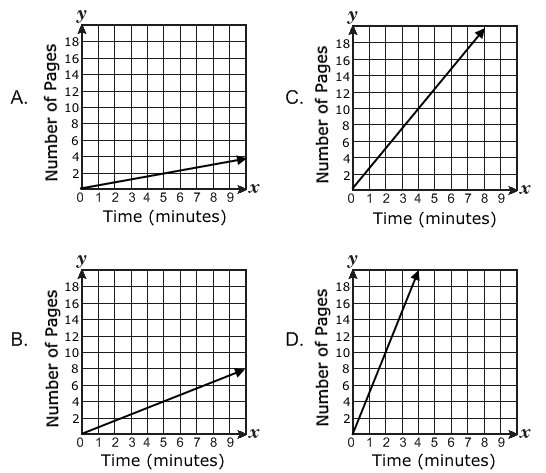
- Q 1/12Score 0Alexis can type 2 pages in 5 minutes. Which graph has a slope that best represents the number of pages per minute Alexis can type?29Choice DChoice CChoice AChoice B


12 questions
Show answers
- Q1Alexis can type 2 pages in 5 minutes. Which graph has a slope that best represents the number of pages per minute Alexis can type?Choice DChoice CChoice AChoice B30s
- Q2The graph below represents the sale of cookies over a period of weeks. Which situation best represents the graph?Julia bakes 18 boxes of cookies every 5 weeks.Marcia sells 9 boxes of cookies every 2 weeks.Mrs. Avery buys 3 boxes of cookies every week.Jacob eats 12 boxes of cookies every 3 weeks.30s
- Q3The data in the table below show the relationship between volume of a substance in quarts, x, and pints, y. Which graph best represents the data in the table above? Quarts, x Pints, y 4 8 6 12 8 16 10 20DCAB30s
- Q4What is the slope of the linear function shown in the graph?-4/5-5/45/44/530s
- Q5Which of the following tables best represents a line with a rate of change of - 5/2?ADCB30s
- Q6The graph below represents the cost, in dollars, for purchasing sweatshirts with a school logo printed on them. Which statement below can be interpreted from analyzing the graph?The cost per sweatshirt is $2.50, not including the set-up fee.The cost per sweatshirt is $75, not including the set-up fee.The sales of sweatshirts is up this year.The price of sweatshirts is increasing.30s
- Q7What is the y-intercept of this line? Record your answer and fill in the bubbles on your answer document. Be sure to use the correct place value. x y -2 8 -1 5 1 -1 2 -4-232-330s
- Q8What is the y-intercept of the graph below?-2.5-1-0.42.830s
- Q9Triangle ABC and triangle DEF are similar right triangles.The slope of BC is greater than the slope of DF.There is no relationship between the slopes of BC and DF.The slope of BC is less than the slope of DF.The slope of BC is equal to the slope of DF.30s
- Q10David made a scale drawing of his bedroom. In his drawing, ½ centimeter represents 10 meters. Which graph best represents this relationship?DBAC30s
- Q11In the distance formula d = rt, r represents the rate of change, or slope. Which ray on the graph best represents a slope of 40 mph?RVTS30s
- Q12The graph of a linear function is shown on the coordinate grid. What is the y-intercept of the graph of the linear function? Record your answer and fill in the bubbles on your answer document. Be sure to use the correct place value.21-22.530s


