Loading...
ST#2: Data Management
Quiz by Chonalyn Tecson
Customize this quiz to suit your class
Instantly translate to 100+ languages
Tag the questions with any skills you have. Your dashboard will track each student's mastery of each skill.
Give this quiz to my class
Aa graphical display of information that changes continuously over time.
bar graph
line graph
histogram
pie chart
It is a pictorial representation of data relative to a whole.
line graph
bar graph
pie chart
histogram
Aa graphical display of information that changes continuously over time.
It is a pictorial representation of data relative to a whole.
The graph that usually compares different categories.
It is used to graphically summarize the distribution of a univariate data set.
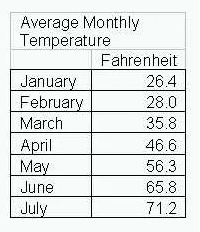
What is the most appropriate graph/chart to present this data
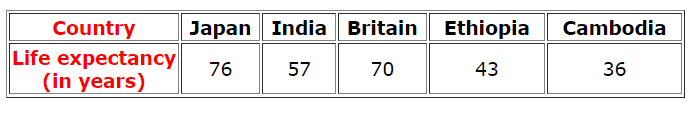
The following table shows the life expectancy (average age to which people live) in various countries in a particular year. What chart or graph would best represent the data?
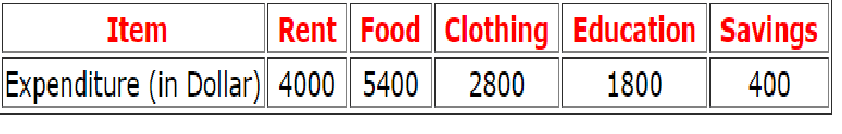
Mr. X monthly income is $ 14400. The monthly expenses of his family on various items are given on the table. What graph/chart would best represent the data?
10 patients whose ages are as follows, 13, 14, 25, 8, 17, 8, 9, 30, 15, 11 were admitted in the hospital today and are confirmed CVID-19 positive. What is the patients average age?
10 patients whose ages are as follows, 13, 14, 25, 8, 17, 8, 9, 30, 15, 11 were admitted in the hospital today and are confirmed CVID-19 positive. What is the median of patients age?
10 patients whose ages are as follows, 13, 14, 25, 8, 17, 8, 9, 30, 15, 11 were admitted in the hospital today and are confirmed CVID-19 positive. What is the mode of patients age?
In the calculation of this measures of central tendency. varying degrees of importance of the numbers in a data set is taken into account.
To know how much homogenous or heterogeneous the data is, What statistical tool is commonly used
It tells where a specific data value falls within the data set in comparison with the other data values.
Find the value in the data set corresponding to the quartile 1.
2, 3, 5, 6, 8, 10, 12, 15, 18, 20
It tells where a specific data value falls within the data set in comparison with the other data values.
Find the value in the data set corresponding to the 3rd quartile.
2, 3, 5, 6, 8, 10, 12, 15, 18, 20
Find the value in the data set corresponding to the 50th percentile.
2, 3, 5, 6, 8, 10, 12, 15, 18, 20
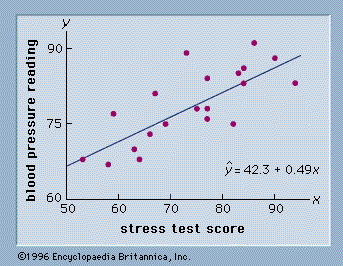
What can you say about the correlation between stress test scores and the blood pressure reading?
What can you say about the correlation between the Body Mass Index(BMI) and the Cholesterol?

Find the value in the data set corresponding to the 80th percentile.
2, 3, 5, 6, 8, 10, 12, 15, 18, 20