STAAR Algebra 1 High School 2013 - Past Paper
Quiz by Algebra I - Texas Education Agency
High School
Math (Archived)
Texas Essential Knowledge and Skills (TEKS)
Feel free to use or edit a copy
includes Teacher and Student dashboards
Measures 29 skills from
Measures 29 skills from
Track each student's skills and progress in your Mastery dashboards
With a free account, teachers can
- edit the questions
- save a copy for later
- start a class game
- automatically assign follow-up activities based on students’ scores
- assign as homework
- share a link with colleagues
- print as a bubble sheet
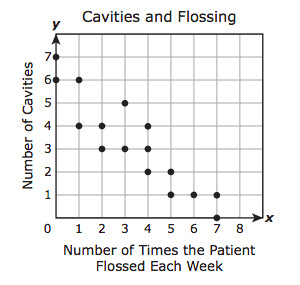
- Q 1/54Score 0A dentist made the scatterplot below to show the number of cavities her patients had as it relates to the number of times they flossed their teeth each week. Which of the following best describes the correlation for the data?29Negative correlationNo correlationNonlinear correlationPositive correlation


54 questions
Show answers
- Q1A dentist made the scatterplot below to show the number of cavities her patients had as it relates to the number of times they flossed their teeth each week. Which of the following best describes the correlation for the data?Negative correlationNo correlationNonlinear correlationPositive correlation45sA.2.D: Direct Variation
- Q245sA.9.D: Graph Exponential Functions
- Q3Which of the following graphs best represents a system of equations that has no solution?45sA.8.B: Solve & Predict Quadratic Functions
- Q4A family will travel 350 miles from their house in order to reach Dallas, TX. Which inequality can be used to find all possible values of t, the time it will take this family to reach Dallas in hours, if they travel at an average speed of at least r miles per hour?60sA.1.C: Using Problem-Solving Tools
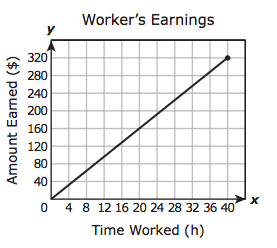
- Q5The graph below shows the relationship between the number of dollars a worker earns and the number of hours worked. What does the slope of the graph represent?The number of hours of work it takes to earn $320The number of hours worked per dollar earnedThe amount of money earned per hourThe amount earned for 40 hours of work60sA.6.B: Quadratic Functions On Graphs
- Q6The perimeter of a rectangle is 42 centimeters. The length of the rectangle can be represented by (x + 4), and its width can be represented by (2x − 7). What are the dimensions of this rectangle in centimeters?Length = 12 and width = 9Length = 10 and width = 11Length = 8 and width = 13Length = 6 and width = 1560sA.4.A: Quantitative Variables
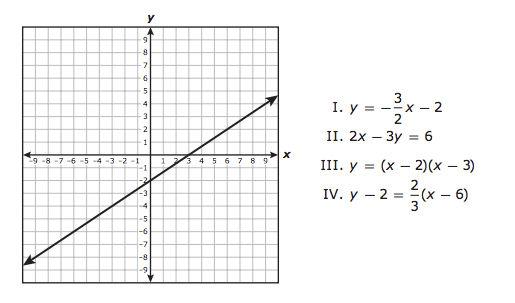
- Q7A graph is shown below. Which of the following equations are represented by the graph?II and IVI and IVII and IIII and III60sA.5.C: Systems Of Linear Equations
- Q860sA.1.D: Mathematical Communications
- Q960sA.4.B: Association & Causation
- Q1060sA.2.D: Direct Variation
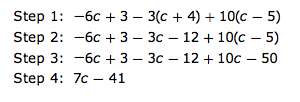
- Q1160sA.11.B: Numerical & Algebraic Expressions
- Q1260sA.8.A: Quadratic Equations
- Q1360sA.2.B: Linear Equations (1)
- Q14Users enter free textType an Answer60sA.12.B: Evaluate Functions
- Q1560sA.10.A: Add & Subtract Polynomials