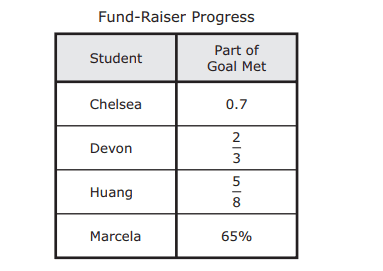
order a set of real numbers arising from mathematical and real-world contexts
distinguish between proportional and non-proportional situations using tables, graphs, and equations in the form y = kx or y = mx + b, where b ≠ 0
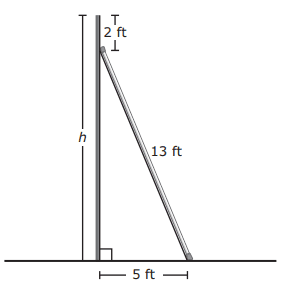
determine the distance between two points on a coordinate plane using the Pythagorean Theorem
calculate and compare simple interest and compound interest earnings
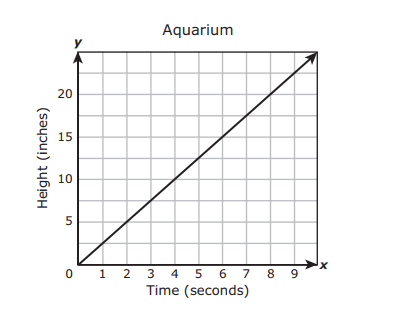
graph proportional relationships, interpreting the unit rate as the slope of the line that models the relationship
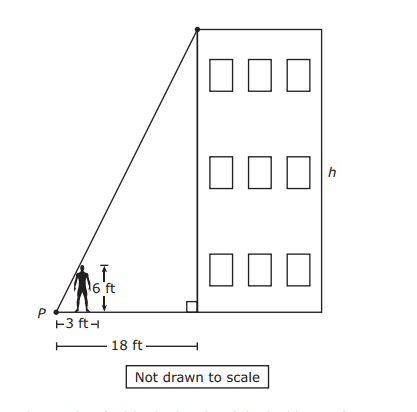
generalize that the ratio of corresponding sides of similar shapes are proportional, including a shape and its dilation
model and solve one-variable equations with variables on both sides of the equal sign that represent mathematical and real-world problems using rational number coefficients and constants
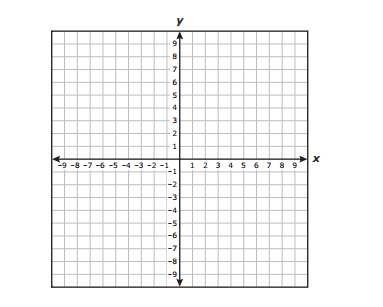
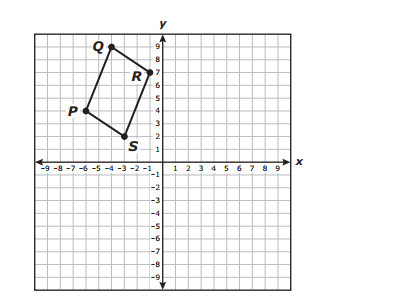
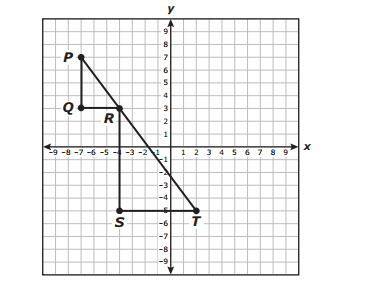
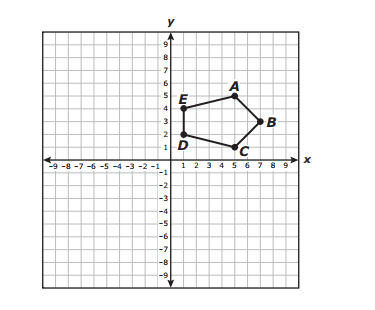
explain the effect of translations, reflections over the x- or y-axis, and rotations limited to 90°, 180°, 270°, and 360° as applied to two-dimensional shapes on a coordinate plane using an algebraic representation
solve problems involving direct variation
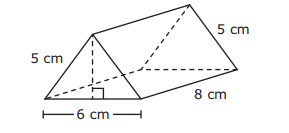
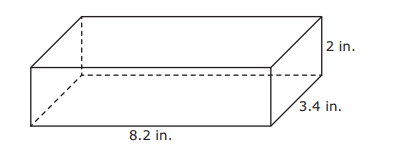
use previous knowledge of surface area to make connections to the formulas for lateral and total surface area and determine solutions for problems involving rectangular prisms, triangular prisms, and cylinders
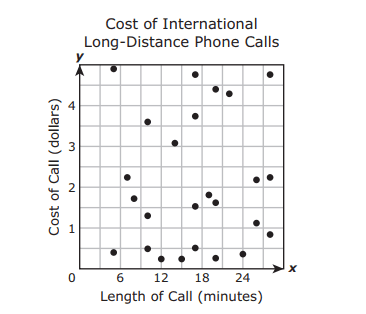
construct a scatterplot and describe the observed data to address questions of association such as linear, non-linear, and no association between bivariate data
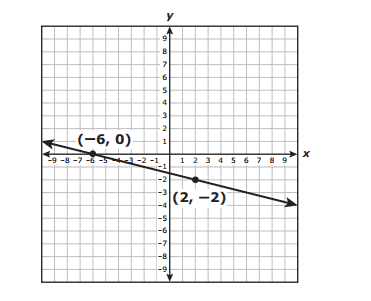
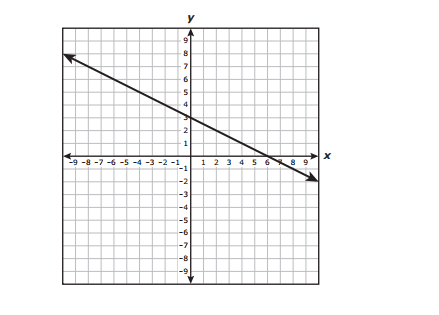
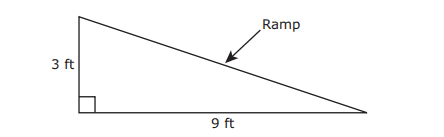
use data from a table or graph to determine the rate of change or slope and y-intercept in mathematical and real-world problems
model the effect on linear and area measurements of dilated two-dimensional shapes
write an equation in the form y = mx + b to model a linear relationship between two quantities using verbal, numerical, tabular, and graphical representations
use the Pythagorean Theorem and its converse to solve problems
represent linear non-proportional situations with tables, graphs, and equations in the form of y = mx + b, where b ≠ 0
solve problems involving the volume of cylinders, cones, and spheres
estimate the cost of a two-year and four-year college education, including family contribution, and devise a periodic savings plan for accumulating the money needed to contribute to the total cost of attendance for at least the first year of college
identify examples of proportional and non-proportional functions that arise from mathematical and real-world problems
convert between standard decimal notation and scientific notation
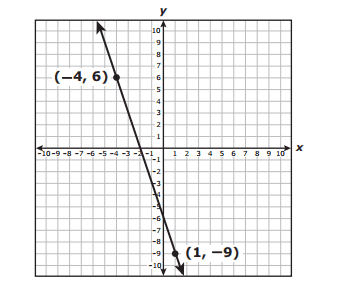
use similar right triangles to develop an understanding that slope, m, given as the rate comparing the change in y-values to the change in x-values, (y2 - y1)/ (x2 - x1), is the same for any two points (x1, y1) and (x2, y2) on the same line
use a trend line that approximates the linear relationship between bivariate sets of data to make predictions
use informal arguments to establish facts about the angle sum and exterior angle of triangles, the angles created when parallel lines are cut by a transversal, and the angle-angle criterion for similarity of triangles
identify functions using sets of ordered pairs, tables, mappings, and graphs
use an algebraic representation to explain the effect of a given positive rational scale factor applied to two-dimensional figures on a coordinate plane with the origin as the center of dilation
describe the volume formula V = Bh of a cylinder in terms of its base area and its height
differentiate between transformations that preserve congruence and those that do not
use models and diagrams to explain the Pythagorean theorem
generalize the properties of orientation and congruence of rotations, reflections, translations, and dilations of two-dimensional shapes on a coordinate plane
approximate the value of an irrational number, including π and square roots of numbers less than 225, and locate that rational number approximation on a number line
determine the mean absolute deviation and use this quantity as a measure of the average distance data are from the mean using a data set of no more than 10 data points
identify and verify the values of x and y that simultaneously satisfy two linear equations in the form y = mx + b from the intersections of the graphed equations
write one-variable equations or inequalities with variables on both sides that represent problems using rational number coefficients and constants
contrast bivariate sets of data that suggest a linear relationship with bivariate sets of data that do not suggest a linear relationship from a graphical representation
Track each student's skills and progress in your Mastery dashboards