STAAR Review Data
Quiz by Kametria Clayton
Feel free to use or edit a copy
includes Teacher and Student dashboards
Measure skillsfrom any curriculum
Measure skills
from any curriculum
Tag the questions with any skills you have. Your dashboard will track each student's mastery of each skill.
With a free account, teachers can
- edit the questions
- save a copy for later
- start a class game
- automatically assign follow-up activities based on students’ scores
- assign as homework
- share a link with colleagues
- print as a bubble sheet
8 questions
Show answers
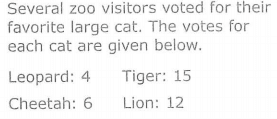
- Q1Which frequency table represents the data?300s
- Q2Which bar graph represents the data in the dot plot?300s
- Q3Which bar graph represents the data in the table?300s
- Q4Which dot plot represents the data?300s
- Q5Which dot plot represents the value in cents of each coin?300s
- Q6Which pictograph represents the rainfall data?300s
- Q7Which bar graph represents the data?300s
- Q8Which table represents the data in the pictograph?300s
