order a set of rational numbers arising from mathematical and real-world contexts
graph points in all four quadrants using ordered pairs of rational numbers
give examples of ratios as multiplicative comparisons of two quantities describing the same attribute
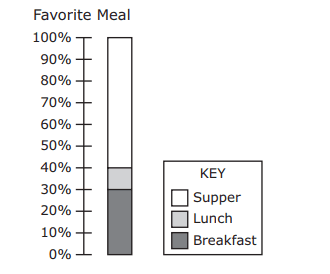
summarize categorical data with numerical and graphical summaries, including the mode, the percent of values in each category (relative frequency table), and the percent bar graph, and use these summaries to describe the data distribution
model and solve one-variable, one-step equations and inequalities that represent problems, including geometric concepts
multiply and divide positive rational numbers fluently
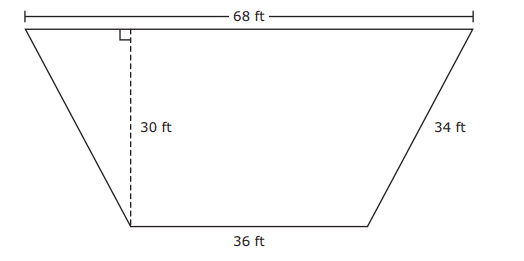
determine solutions for problems involving the area of rectangles, parallelograms, trapezoids, and triangles and volume of right rectangular prisms where dimensions are positive rational numbers
write one-variable, one-step equations and inequalities to represent constraints or conditions within problems
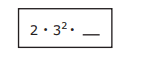
generate equivalent numerical expressions using order of operations, including whole number exponents and prime factorization
extend previous knowledge of triangles and their properties to include the sum of angles of a triangle, the relationship between the lengths of sides and measures of angles in a triangle, and determining when three lengths form a triangle
solve real-world problems to find the whole given a part and the percent, to find the part given the whole and the percent, and to find the percent given the part and the whole, including the use of concrete and pictorial models
distinguish between debit cards and credit cards
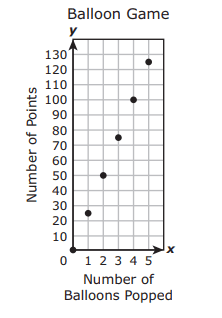
represent a given situation using verbal descriptions, tables, graphs, and equations in the form y = kx or y = x + b
interpret numeric data summarized in dot plots, stem-and-leaf plots, histograms, and box plots
write corresponding real-world problems given one-variable, one-step equations or inequalities
generate equivalent expressions using the properties of operations: inverse, identity, commutative, associative, and distributive properties
apply qualitative and quantitative reasoning to solve prediction and comparison of real-world problems involving ratios and rates
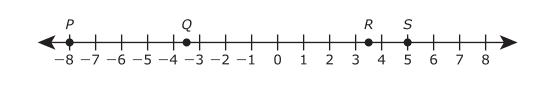
locate, compare, and order integers and rational numbers using a number line
determine, with and without computation, whether a quantity is increased or decreased when multiplied by a fraction, including values greater than or less than one
write equations that represent problems related to the area of rectangles, parallelograms, trapezoids, and triangles and volume of right rectangular prisms where dimensions are positive rational numbers
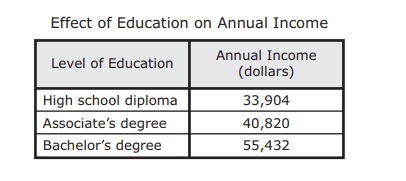
compare the annual salary of several occupations requiring various levels of post-secondary education or vocational training and calculate the effects of the different annual salaries on lifetime income
represent mathematical and real-world problems involving ratios and rates using scale factors, tables, graphs, and proportions
add, subtract, multiply, and divide integers fluently
summarize numeric data with numerical summaries, including the mean and median (measures of center) and the range and interquartile range (IQR) (measures of spread), and use these summaries to describe the center, spread, and shape of the data distribution
extend representations for division to include fraction notation such as a/b represents the same number as a ÷ b where b ≠ 0
determine if the given value(s) make(s) one-variable, one-step equations or inequalities true
generate equivalent forms of fractions, decimals, and percents using real-world problems, including problems that involve money
use the graphical representation of numeric data to describe the center, spread, and shape of the data distribution
convert units within a measurement system, including the use of proportions and unit rates
Track each student's skills and progress in your Mastery dashboards