Loading...

Star Trek: Graphs and Charts
Quiz by TeamFS
Tag the questions with any skills you have. Your dashboard will track each student's mastery of each skill.
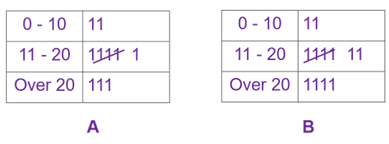
Which of the following tally charts match the data below?
2,13, 36, 7, 18, 13, 28, 19, 21, 20, 13,12


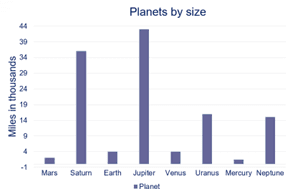
Which planet is the third largest in the solar system?

Saturn
Earth
Jupiter
Uranus
Neptune
Which of the following tally charts match the data below?
2,13, 36, 7, 18, 13, 28, 19, 21, 20, 13,12
Which planet is the third largest in the solar system?
Which cadet has the best average (mean) score over the 4 topics?
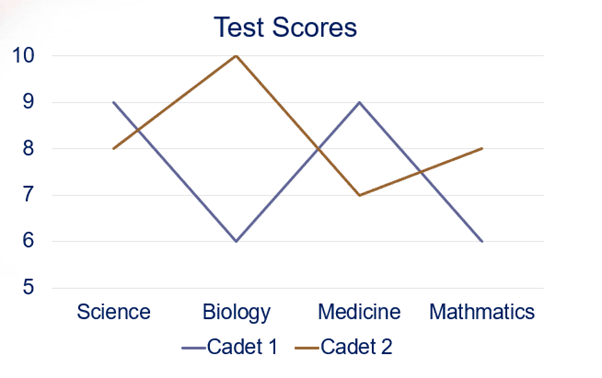
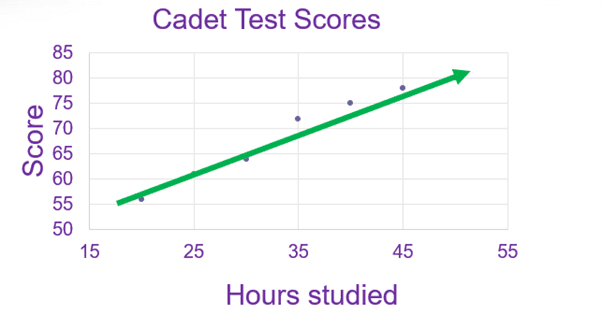
What correlation does the graph below show?
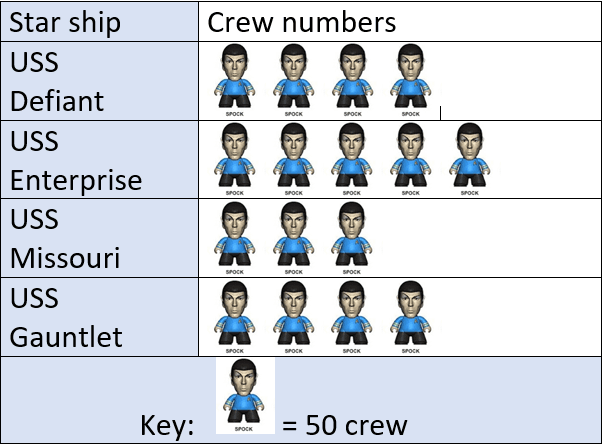
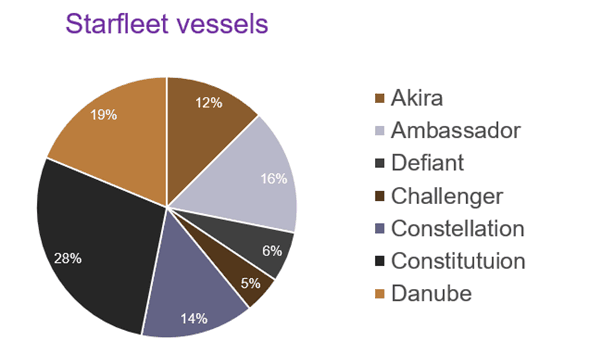
Below is the different class types of spacecraft in Starfleet.
What is the largest class in the fleet?
You have been given a list of the cadet’s final test score and you have been asked to present these in a suitable graph.
What type graph would you use?
How many crew members are on board the USS Enterprise?