Tag the questions with any skills you have. Your dashboard will track each student's mastery of each skill.
Give this quiz to my class
Q 1/30
Score 0
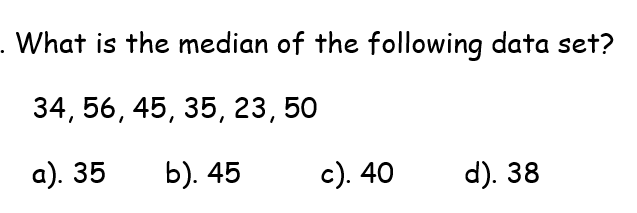
Find the median
30
d
c
b
a
Q 2/30
Score 0
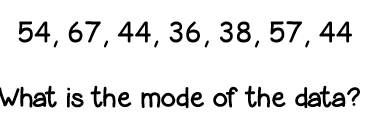
What is the mode?
45
54
there is no mode
44
21
30 questions
Q.
Find the median
1
30 sec
Q.
What is the mode?
2
45 sec
Q.
Find the mean
3
60 sec
Q.
Find the IQR
4
60 sec
Q.
Find the lower extreme/minimum (LE)
5
30 sec
Q.
Find the Lower Quartile (Q1)
6
60 sec
Q.
Find the upper extreme (UE) or maximum
7
60 sec
Q.
Find the upper quartile (Q3)
8
60 sec
Q.
What is the median?
9
60 sec
Q.
Find the range
10
60 sec
Q.
Find MAD. Round to nearest tenth
11
120 sec
Q.
Find MAD. Round to nearest tenth
12
120 sec
Q.
What is the lower quartile?
13
60 sec
Q.
How many students were surveyed?
14
120 sec
Q.
Which measure of center bests represents the data?
15
120 sec
Q.
What is the median
16
120 sec
Q.
How many days did the traffic engineer collect data?
17
120 sec
Q.
How many days days did Colleen spend training?
18
120 sec
Q.
What is the 5 number summary?
19
120 sec
Q.
what is the MAD?
20
120 sec
Q.
What is the mean?
21
120 sec
Q.
What is the mode?
22
120 sec
Q.
which data sets represents the box plot?
23
120 sec
Q.
70 runs were scored in 20 games. The amount of runs scores during 19 baseball games are represented on the line plot. How many runs were scored during the 20th game?
24
120 sec
Q.
Wendy scored between 85 and 95 on her previous math tests. She earned a 70 on the next one. Which statement is true?
25
120 sec
Q.
The line plot shows the number of absences of children who attend middle school. Which statement describes the spread of data?
26
120 sec
Q.
Which cannot be determined from the data?
27
120 sec
Q.
Nicole collected data from DMS. Which question is statistical?
28
120 sec
Q.
What is the median?
29
120 sec
Q.
How many times did more that 6 dogs attend the park?