

Stats chapter 7
Quiz by Corey Klein
Feel free to use or edit a copy
includes Teacher and Student dashboards
Measure skillsfrom any curriculum
Measure skills
from any curriculum
Tag the questions with any skills you have. Your dashboard will track each student's mastery of each skill.
With a free account, teachers can
- edit the questions
- save a copy for later
- start a class game
- automatically assign follow-up activities based on students’ scores
- assign as homework
- share a link with colleagues
- print as a bubble sheet
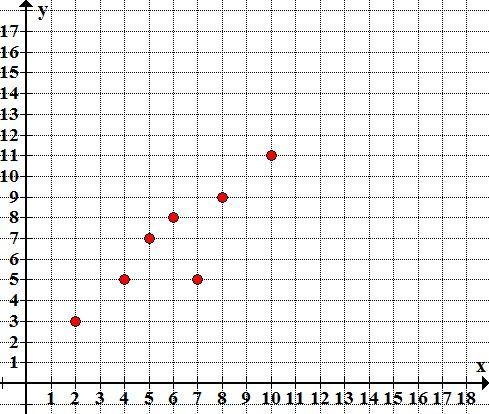
- Q 1/8Score 0The correlation r for the data in this scatterplot is?29r = .876r = -.954r = .995r = . 657


8 questions
Show answers
- Q1The correlation r for the data in this scatterplot is?r = .876r = -.954r = .995r = . 65730s
- Q2The correlation r for the data in this scatterplot is?r = -.852r = - .647r = -.452r = .94330s
- Q3What is the correlation coeficient, r, for the scatterplot?r = .365r = .764r = .046r = .51830s
- Q4A local community college announces the correlation between college entrance exam grades and scholastic achievement was found to be -1.08. On the basis of this, you would tell the college thatstudents who do best on this exam will be poor students.the exam is a poor predictor of success.the entrance exam is a good predictor of success.the college should hire a new statistician.60s
- Q5A study found correlation r = 0.61 between the sex of a worker and his or her income. You conclude thatwomen earn more than men on average.this is nonsense because r makes no sense here.there is a moderately strong, positive, linear relationship between sex and income.women earn less than men on average.60s
- Q6If Data Set A of (x , y) data has correlation coefficient r = 0.65, and a second Data Set B has correlation r = -0.65, thenneither A nor B has a strong linear association.A and B are actually the same data set.the points in A exhibit a stronger linear association than B.you can’t tell which data set has a stronger linear association without seeing the data or seeing the scatterplots.60s
- Q7Which of the following statements are correct? I. Two variables that are strongly associated will have a correlation near 1. II. Regression requires an explanatory-response relationship, while correlation does not. III. Even though the correlation between two variables may be high, in order to use the LSRL to predict, there needs to be an explanatory-response relationship between x and y.I, II, and IIII and II onlynone of these gives the complete set of true responsesI and III only60s
- Q8Suppose the correlation between two variables x and y is due to the fact that both are responding to changes in some unobserved third variable. What is this due to?cause and effect between x and ythe effect of the Illuminatiextrapolationthe effect of a lurking variable60s

