Tag the questions with any skills you have. Your dashboard will track each student's mastery of each skill.
Give this quiz to my class
Q 1/16
Score 0
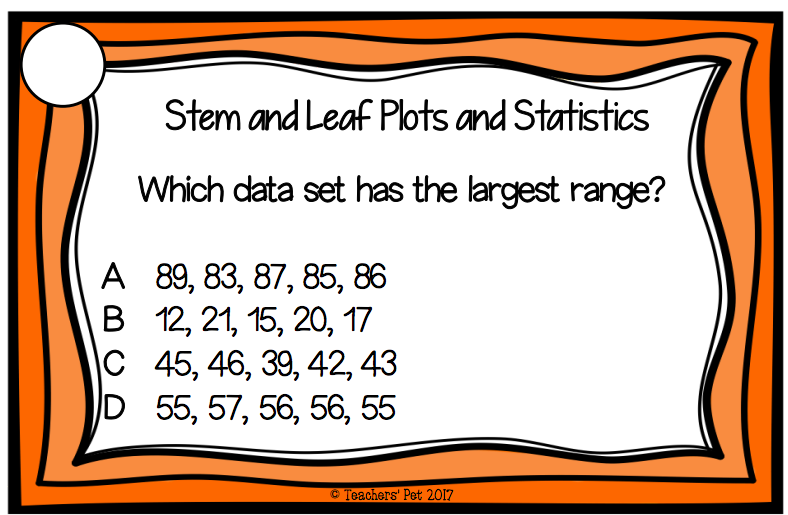
Which data set has the largest range?
120
89, 83, 87, 85, 86
45, 46, 39, 42, 43
55, 57, 56, 56, 55
12, 21, 15, 20, 17
Q 2/16
Score 0
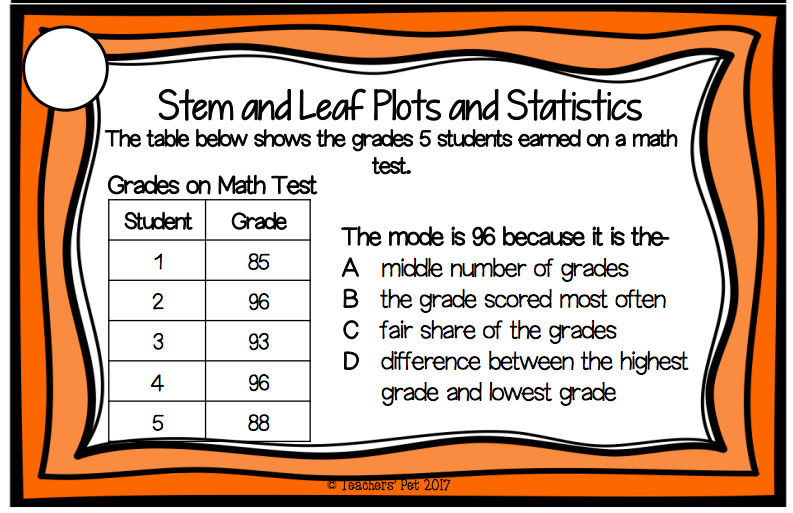
The mode is 96 because it is the
120
the grade scored most often
middle number of grades
fair share of the grades
difference between the highest grade and lowest grade
16 questions
Q.
Which data set has the largest range?
1
120 sec
Q.
The mode is 96 because it is the
2
120 sec
Q.
What is the median for this set of data?
3
120 sec
Q.
Based on the information in the stem and leaf plot, what was the largest number of animals treated on any day?
4
120 sec
Q.
The bar graph below shows the number of candy grams sold each day for 5 days. What is the mean number of candy bars sold during these 5 days?
5
120 sec
Q.
What is the mode of the data shown in the line plot?
6
120 sec
Q.
If the number 10 was added to the data set, which of the following would be true?
7
120 sec
Q.
What is the range of the data shown in the stem and leaf plot?
8
120 sec
Q.
Meredith emptied the marbles from the jars and put a fair share of the marbles into each of the 5 jars. The number of marbles she will put in each jar represents the ...
9
120 sec
Q.
Which set of data has a median of 14?
10
120 sec
Q.
The table shows the amount of money each student spent while on a field trip. What is the mode of this data?
11
120 sec
Q.
Based on the information in the stem and leaf plot, what is the age of the oldest teacher?
12
120 sec
Q.
The line plot shows the number of miles each student lives from school. What is the range of this data?
13
120 sec
Q.
Which data set has the smallest range?
14
120 sec
Q.
The median is 8 because it is the ...
15
120 sec
Q.
She found the mean, median, mode and range of this set of data. Which of the following is true?