Supply and Demand
Quiz by Shawna Farbotnik
Feel free to use or edit a copy
includes Teacher and Student dashboards
Measure skillsfrom any curriculum
Measure skills
from any curriculum
Tag the questions with any skills you have. Your dashboard will track each student's mastery of each skill.
With a free account, teachers can
- edit the questions
- save a copy for later
- start a class game
- automatically assign follow-up activities based on students’ scores
- assign as homework
- share a link with colleagues
- print as a bubble sheet
11 questions
Show answers
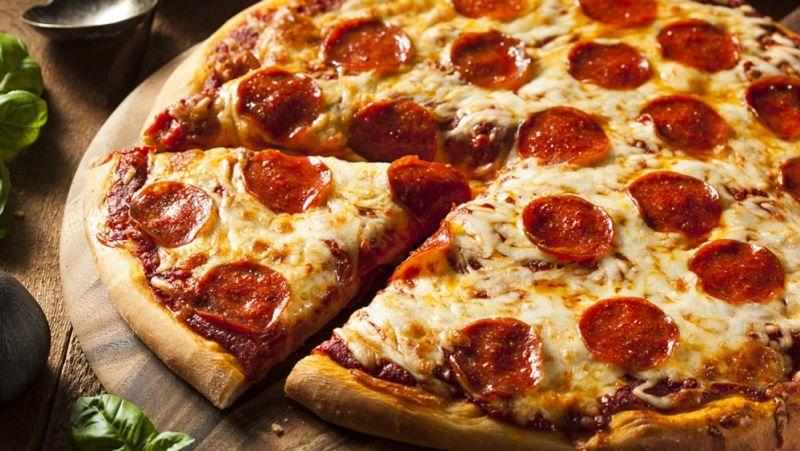
- Q1Which would be a likely cause of an increase in the price of pizza?a decrease in the price of hamburgers, a substitute fooda health report showing eating pizza reduces stressa decreased interest in take-out and fast-food dininga decrease in the price of cheese, a complement30s
- Q2Which best describes the relationship b/w price & quantity demanded shown by the demand curve?as a product's price rises, consumers buy less other goodsthere's an inverse relationship bw price & quantity demandedas the product's price falls, consumers buy less of the goodtheres an indirect relationship between price & quantity demanded30s
- Q3Which statement best explains the movement from S1 to S2 shown on this graph?higher costs for natural resourcesan increase in workers’ salariestechnological improvements in productiona decline in the production of a substitute good30s
- Q4What does the point of intersection shown on this graph represent?opportunity costmarginal productionelasticityequilibrium price30s
- Q5Which statement best describes the relationship between supply and demand?A product with high demand & high supply leads to a decrease in priceA product with high demand & low supply leads to an increase in priceA product with low demand & low supply leads to an increase in priceA product with low demand & high supply leads to no change in price30s
- Q6Which term replaces this question mark?marginal benefitsupplyconsumptionfixed costs30s
- Q7The amount of a good/service that consumers are willing, able, and want to buy at a particular price:final product.quantity demanded.marginal utility.personal savings.30s
- Q8When the quantity demanded for a product is less than the quantity supplied, the markethas a surplus of productsis in equilibriumprice is too lowhas a shortage of products30s
- Q9Which economic change best explains a reduction in coffee prices?improved technology for commercial productionincreased need for subsistence farmingrapid wage increases for factory workersadoption of tariffs on imported goods30s
- Q10Which statement best supports the shift demonstrated in this graph?A decrease in frozen yogurt price increases ice cream supplyA decrease dairy products cost increases supply of ice creamAn increase in price of sugar reduces supply of ice creamIncrease in frozen yogurt price decreases ice cream supply30s
- Q11What will be the state of the market if peanuts are sold for $5 per pound?There will be a 60,000-pound shortage.There will be a 30,000-pound shortageThere will be a 30,000-pound surplus.There will be a 60,000-pound surplus.30s
