TEKS Science Grade 6 - 6.8.D: Measure & Graph Changes In Motion
Quiz by Grade 6 Science - Texas Education Agency
Grade 6
Science (2010) (Archived)
Texas Essential Knowledge and Skills (TEKS)
Feel free to use or edit a copy
includes Teacher and Student dashboards
Measures 1 skill from
Measures 1 skill from
Track each student's skills and progress in your Mastery dashboards
With a free account, teachers can
- edit the questions
- save a copy for later
- start a class game
- automatically assign follow-up activities based on students’ scores
- assign as homework
- share a link with colleagues
- print as a bubble sheet


5 questions
Show answers
- Q1A car travels at a constant speed of 15 m/s for 2 minutes. The car increases its speed from 15 to 25 m/s during the next minute and then travels at a constant speed of 25 m/s for 2 more minutes. Which of the following graphs best represents the car’s motion during this 5-minute period?#texas/83c26e54-1342-4a8c-a460-b3bc9f4ea49f/C.png#texas/83c26e54-1342-4a8c-a460-b3bc9f4ea49f/B.png#texas/83c26e54-1342-4a8c-a460-b3bc9f4ea49f/D.png#texas/83c26e54-1342-4a8c-a460-b3bc9f4ea49f/A.png300s6.8.D: Force, Motion and Energy
- Q2A student runs two times around a running path at a local park. Each lap is 3 km. The student completes the first lap in 20 minutes. The student then sits on a bench and rests for 5 minutes before completing the second lap in 25 minutes. Which graph best represents the student’s motion?#texas/3b333deb-3d2d-4f0a-bead-bafc9856e79e/A.png#texas/3b333deb-3d2d-4f0a-bead-bafc9856e79e/C.png#texas/3b333deb-3d2d-4f0a-bead-bafc9856e79e/D.png#texas/3b333deb-3d2d-4f0a-bead-bafc9856e79e/B.png300s6.8.D: Force, Motion and Energy
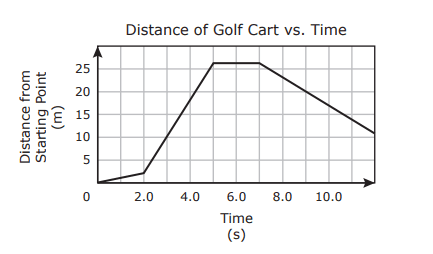
- Q3A golfer collected data on the distance a golf cart traveled in a straight line and plotted it on a graph. Which of these does NOT describe the cart’s motion on this graph?The cart moved 11 m toward the starting point between 8 s and 10 s.The cart moved away from the starting point at a speed of 1 m/s for 2 s.The cart moved 24 m away from the starting point between 2 s and 5 s.The cart moved toward the starting point at a speed of 3 m/s between 7 s and 12 s.300s6.8.D: Force, Motion and Energy
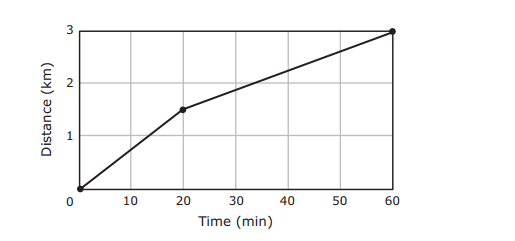
- Q4The graph below shows distance over time. Which of these situations could be represented by this graph?A student walks 1.5 km to a friend’s house in 20 minutes. The two students then walk another 1.5 km to school in 60 minutes.A student walks 1.5 km to a friend’s house in 20 minutes. The two students then walk another 1.5 km to school in 40 minutes.A student walks 1.5 km to a friend’s house in 30 minutes. The two students then walk another 1.5 km to school in 30 minutes.A student walks 1.5 km to a friend’s house in 40 minutes. The two students then walk another 1.5 km to school in 20 minutes.300s6.8.D: Force, Motion and Energy
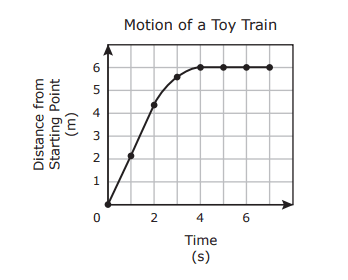
- Q5A hobbyist collected data about the motion of a toy train on a straight track and then recorded the data in the graph below. Which of these accurately describes the motion of the toy train?The toy train speeds up while going forward and then slows down.The toy train moves forward at a constant speed, slows down, and then stops.The toy train moves forward at an increasing speed, stops, and then moves forward.The toy train slows down while going forward and then moves backward.300s6.8.D: Force, Motion and Energy