Loading...
Theme 1 - Market Failure - Taxes and Subsidies
Quiz by Mark Seccombe
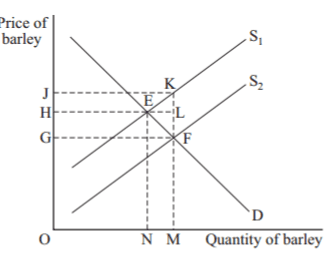
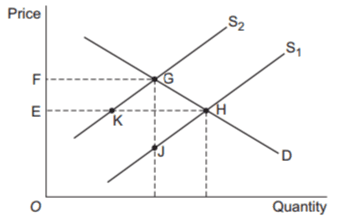
In the diagram, the government grants a subsidy to manufacturers of loft insulation. This shifts the market supply curve from S1 to S2. The total amount spent by the government on subsidies is represented by the area
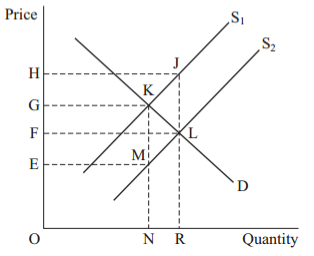
OHJR
EKGM
FHJL
OFLR
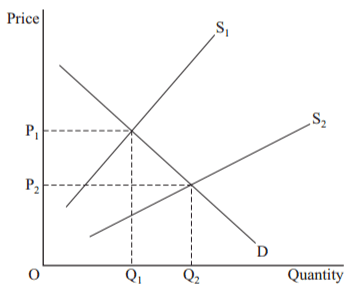
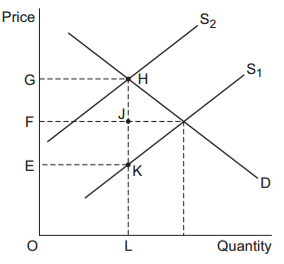
To reduce production and consumption of the good from Q1 to Q2, the government could impose a
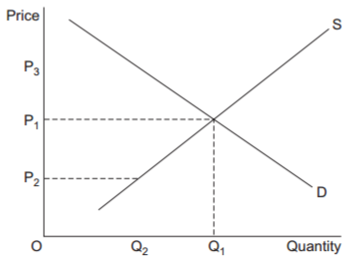
tax of P2 to P1
tax of P2 to P3
minimum price of 0P2
price ceiling of OP3
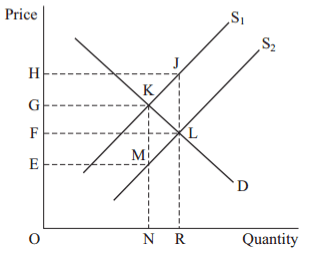
In the diagram, the government grants a subsidy to manufacturers of loft insulation. This shifts the market supply curve from S1 to S2. The total amount spent by the government on subsidies is represented by the area
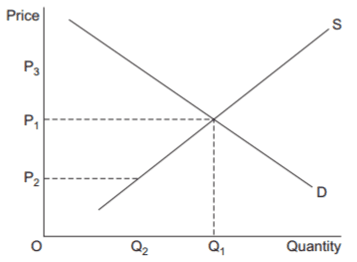
To reduce production and consumption of the good from Q1 to Q2, the government could impose a
The government wants to reduce the amount of air pollution arising from petrol and diesel used in transport. Which one of the following combinations of policies would be most likely to achieve this?
The rightward shift of the supply curve from S1 to S2 could be caused by
Total government spending on the subsidy is shown by the area
The abolition of at tax on betting can be shown by the
Assuming the price elasticity of demand for a product is zero, any tax placed on the product will
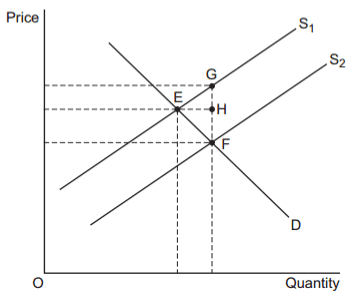
As a result of government intervention, the market equilibrium has moved from point E to point F. The good is
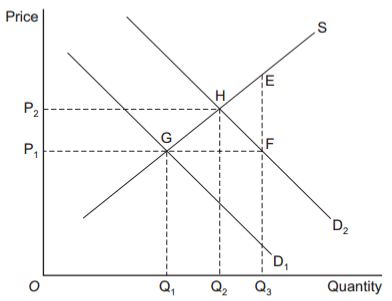
The demand curve for the good shifts from D1 to D2, raising the market price from P1 to P2. To reduce the price back to P1, the government could introduce a
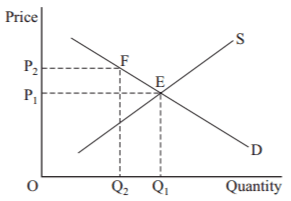
The initial market equilibrium is at point E. To avoid a misallocation of resources in the market, the government could

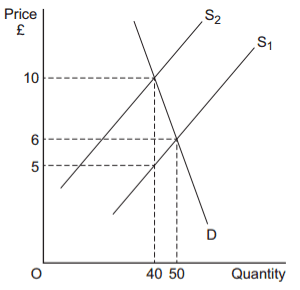
An indirect tax shifts supply from S1 to S2. The amount of tax is
A tax shifts the supply curve from S1 to S2. The amount of revenue raised by the government is shown by
The subsidy paid per unit of the good sold is
The free market price of a good with positive externalities is £50 per unit. This failure could be corrected by
Social housing is provided to low income households at rents which are lower than the free market rent. Which of the following explains why it is subsidised
The imposition of a tax shifts supply from S1 to S2. The tax per unit is
Which of the following statements about subsidies is true?