Our brand new solo games combine with your quiz, on the same screen

Correct quiz answers unlock more play!

New Quizalize solo game modes
18 questions
Show answers
  • Q1
    Which one of the following would shift the supply curve for a good to the left? A decrease in...
    in demand for the good
    the elasticity of supply of the good
    subsidies granted to producers
    the rate of growth of labour productivity
    45s
    1.2.4
  • Q2
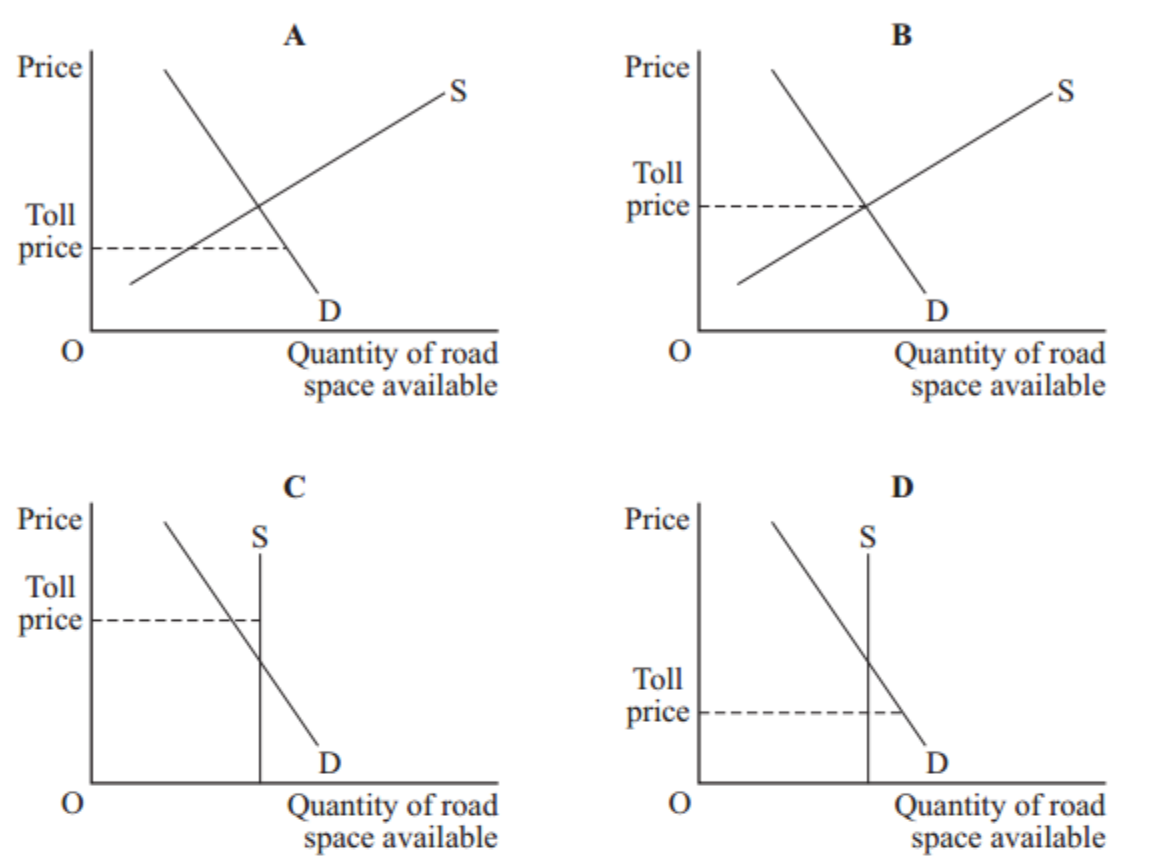
    Which one of the following diagrams, A, B, C or D, shows that there is ‘excess capacity on the motorway’?
    Question Image
    A
    B
    C
    D
    45s
    1.2.7
  • Q3
    The demand curve will shift to the left if
    the price of the good increases
    there is a successful advertising campaign for the good
    the price of complementary goods increases
    the tax on the good increases
    45s
    1.2.2
  • Q4
    The change in price from P1 to P2 and output from Q1 to Q2 could have been caused by
    Question Image
    economies of scale
    the shift of the demand curve
    monopoly replacing competition in the market
    the government subsidizing the production of a merit good
    45s
    1.2.4
  • Q5
    The rightward shift of the supply curve from S1 to S2 could be caused by
    Question Image
    an increase in the demand for the good
    the creation of a monopoly by the firms in the industry supplying the good
    a reduction in the rate of Value Added Tax (VAT) applied to the good
    a decrease in the cost of the raw materials used in the production of a substitute good
    45s
    1.2.4
  • Q6
    A market is defined as being in equilibrium when
    there is maximum output at minimum cost
    prices are at their lowest possible level
    consumer satisfaction is maximized
    there is no tendency for the market price to change
    45s
    1.2.6
  • Q7
    The abolition of betting tax led to an estimated 37% increase in sales during the last quarter at Stanley's, a chain of betting shops. Betting tax was an indirect tax on each bet placed by customers. The abolition of betting tax can be shown by the
    supply curve of bets shifting to the left
    demand curve for bets shifting to the right
    demand curve for bets shifting to the left
    supply curve of bets shifting to the right
    45s
    1.2.4
  • Q8
    The diagram shows the demand for, and supply of, rail services. The shift of the curve from D1 to D2 is most likely to result from
    Question Image
    a government decision to increase subsidies for rail travel
    a planned expansion of the government's railway-track building programme
    a reduction in the tax imposed on the price of a litre of petrol
    a decision by the government to impose a tax on workplace car-parking
    45s
    1.2.2
  • Q9
    The diagram below illustrates the market for a good which has been the subject of government intervention. As a result, the market equilibrium has moved from point E to point F. Which one of the following is most likely to be true?
    Question Image
    a public good which is in short supply and has been rationed by the government
    a demerit good which has been taxed
    an agricultural good subject to a maximum price of OP2
    an essential good which has been subsidized
    45s
    1.4.1a
  • Q10
    The increase in price of milk from P1 to P2 is most likely to be a result of
    Question Image
    a successful advertising campaign for a milk substitute and a tax on milk
    a decrease in wages paid to all workers, including farm workers
    a decrease in the population and an increase in the subsidy on milk
    an increase in milk production costs and a decrease in the price of complementary goods to milk
    45s
    1.2.6
  • Q11
    The price of cocoa more than doubled over an 18-month period as a result of increased buying on world markets. Such a development in the cocoa market could be shown on a supply and demand diagram by
    a movement along the demand curve to the left
    a shift of the demand curve to the left
    a movement along the demand curve to the right
    a shift of the demand curve to the right
    45s
    1.2.2
  • Q12
    The shift of the supply curve from S1 to S2 is most likely to have resulted from
    Question Image
    a fall in the price of frozen fish
    an increased preference for fresh fish by the consumer
    an increase in the wages of fishermen
    improved technology in the fishing industry
    45s
    1.2.4
  • Q13
    All other things being equal, the upward slope of the supply curve is due to
    the elasticity of supply exceeding the elasticity of demand
    higher prices providing an incentive for firms to increase their productive efficiency
    higher prices providing a profit incentive for firms to expand production
    the existence of a monopoly in the industry
    45s
    1.2.4
  • Q14
    In a typical demand schedule, quantity demanded
    varies inversely with price
    is determined by the elasticity of demand
    varies directly with price
    varies proportionately with price
    45s
    1.2.2
  • Q15
    Which of the following would cause a shift to the right of demand for a normal good?
    a decrease in the price of a close substitute
    consumers’ expectations that the price of the good is about to fall
    an increase in the price of a complementary good
    an increase in the income of buyers
    45s
    1.2.2

Teachers give this quiz to your class