Demonstrate energy transformations such as energy in a flashlight battery changes from chemical energy to electrical energy to light energy.
Track each student's skills and progress in your Mastery dashboards
Give this quiz to my class
Q 1/20
Score 0
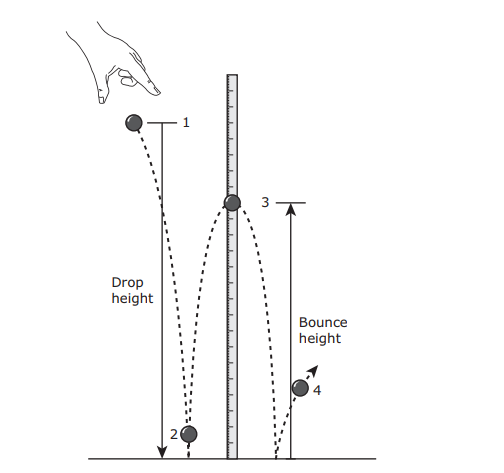
In the classroom demonstration shown below, a rubber ball is dropped from Position 1. The ball bounces as shown. At which of these positions does the ball have both the greatest kinetic energy and the least potential energy?
60
Position 1
Position 2
Position 4
Position 3
Q 2/20
Score 0
A car travels at a constant speed of 15 m/s for 2 minutes. The car increases its speed from 15 to 25 m/s during the next minute and then travels at a constant speed of 25 m/s for 2 more minutes. Which of the following graphs best represents the car’s motion during this 5-minute period?
60
#texas/83c26e54-1342-4a8c-a460-b3bc9f4ea49f/C.png
#texas/83c26e54-1342-4a8c-a460-b3bc9f4ea49f/B.png
#texas/83c26e54-1342-4a8c-a460-b3bc9f4ea49f/D.png
#texas/83c26e54-1342-4a8c-a460-b3bc9f4ea49f/A.png
20 questions
Q.
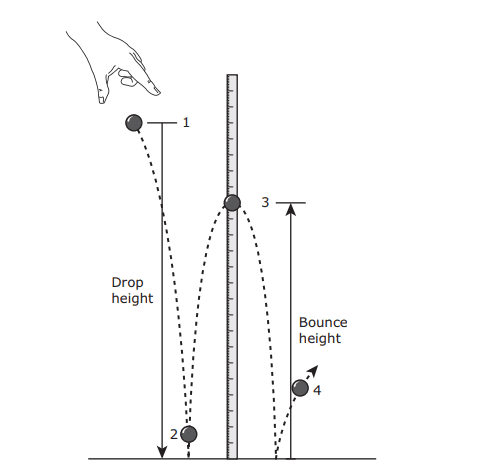
In the classroom demonstration shown below, a rubber ball is dropped from Position 1. The ball bounces as shown. At which of these positions does the ball have both the greatest kinetic energy and the least potential energy?
1
60 sec
6.8a
Q.
A car travels at a constant speed of 15 m/s for 2 minutes. The car increases its speed from 15 to 25 m/s during the next minute and then travels at a constant speed of 25 m/s for 2 more minutes. Which of the following graphs best represents the car’s motion during this 5-minute period?
2
60 sec
6.8d
Q.
A student walks 2 km in 30 minutes. What is the student’s average speed in km/h? Be sure to use the correct place value.
3
60 sec
6.8c
Q.
The diagram below shows a hot air balloon rising. Propane gas tanks are seen at the bottom of the balloon. What energy transformations occur when propane gas is used to lift the balloon?
4
60 sec
6.9c
Q.
The main parts of a working clothes dryer are shown in the diagram. This appliance dries clothes primarily by converting —
5
60 sec
6.9c
Q.
A bus travels 20 km in 30 minutes. What is the average speed of the bus?
6
60 sec
6.8c
Q.
A student drew the diagram below to show the movement of water through a hydroelectric dam. The student used the diagram to describe changes in the potential and kinetic energy of the water. At which location is the gravitational potential energy of the water the greatest?
7
60 sec
6.8a
Q.
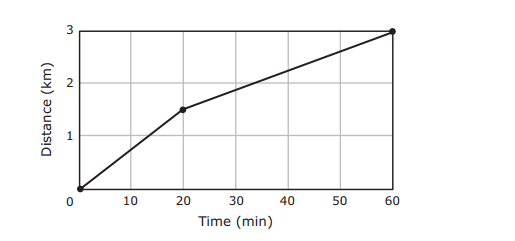
A student runs two times around a running path at a local park. Each lap is 3 km. The student completes the first lap in 20 minutes. The student then sits on a bench and rests for 5 minutes before completing the second lap in 25 minutes. Which graph best represents the student’s motion?
8
60 sec
6.8d
Q.
A cook heats a meal in a microwave oven. What energy transformations occur between the microwave oven and the meal?
9
60 sec
6.9c
Q.
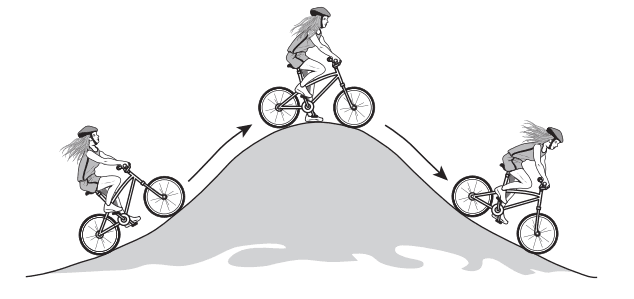
A bicycle rider is traveling up a hill. When the rider reaches the top of the hill, she stops to rest. Then she travels down the hill. The diagram shows the rider in the three different positions. Which of these correctly describes the potential energy and the kinetic energy of the bicycle rider?
10
60 sec
6.8a
Q.
A golfer collected data on the distance a golf cart traveled in a straight line and plotted it on a graph. Which of these does NOT describe the cart’s motion on this graph?
11
60 sec
6.8d
Q.
A student kicks a soccer ball three times. Another student records the distance, the amount of time the ball travels, and the average speed in the table shown below. How many seconds did it take for the ball to travel 30 m during Kick 3?
12
60 sec
6.8c
Q.
Four students were asked to classify the activities of the people in the picture below as examples of either potential or kinetic energy. Which student correctly classified the activities?
13
60 sec
6.8a
Q.
When a lion eats a zebra and then uses the energy from the zebra to run, the lion’s body converts —
14
60 sec
6.9c
Q.
The graph below shows distance over time. Which of these situations could be represented by this graph?
15
60 sec
6.8d
Q.
Some students were investigating the speed of a toy car they built. They performed two trials and recorded their data in the table below. What was the average speed of the toy car during the two trials to the nearest tenth of a m/s? Be sure to use the correct place value.
16
60 sec
6.8c
Q.
The graph below shows the motion of a ball rolling on a straight track. What was the ball’s average speed during the time represented in the graph?
17
60 sec
6.8c
Q.
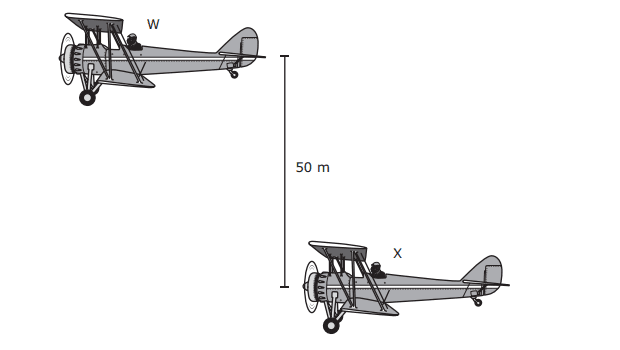
The drawing shows two identical airplanes at an air show. The airplanes are flying at the same speed. Airplane W is flying 50 m higher than Airplane X. Which statement best describes the energy of the two airplanes?
18
60 sec
6.8a
Q.
A hobbyist collected data about the motion of a toy train on a straight track and then recorded the data in the graph below. Which of these accurately describes the motion of the toy train?
19
60 sec
6.8d
Q.
A teacher rubbed a match against a piece of sandpaper. The match started to burn. Which statement best describes the energy changes that occurred?