Describe components of the universe, including stars, nebulae, and galaxies, and use models such as the Hertzsprung-Russell diagram for classification;
Recognize that the Sun is a medium-sized star located in a spiral arm of the Milky Way galaxy and that the Sun is many thousands of times closer to Earth than any other star;
Track each student's skills and progress in your Mastery dashboards
Give this quiz to my class
Q 1/28
Score 0
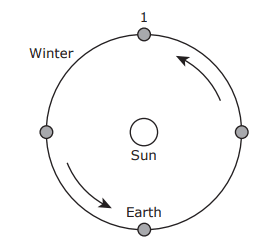
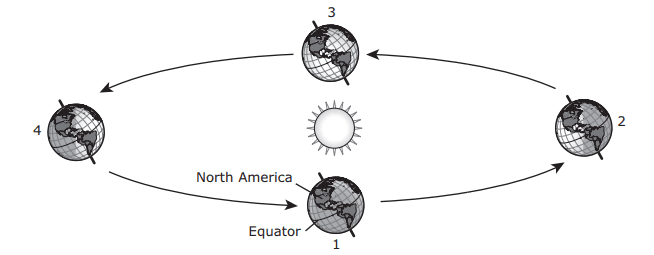
Students in a science class in Marfa, Texas, made a poster with a diagram to represent a seasonal change in the Northern Hemisphere. Which statement best describes conditions for Earth at Position 1 in the diagram?
60
There are an equal number of hours of daylight and nighttime in the Northern Hemisphere, and the North Pole is tilted away from the sun.
The Northern Hemisphere has the fewest hours of daylight, and the North Pole is tilted away from the sun.
There are an equal number of hours of daylight and nighttime in the Northern Hemisphere because Earth’s axis is not tilted in this position.
The Northern Hemisphere has the fewest hours of daylight, and Earth’s axis does not tilt at this position.
Q 2/28
Score 0
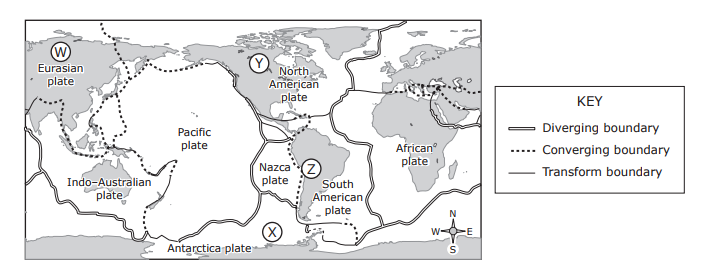
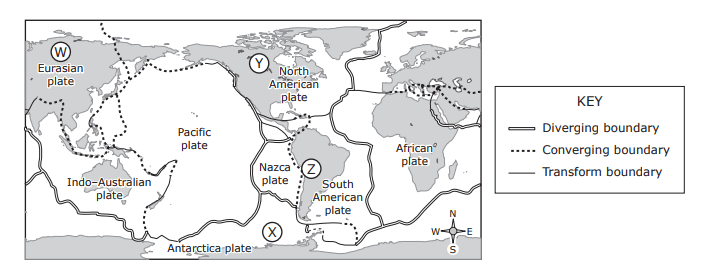
The map shows some of Earth’s plate tectonic boundaries. Based on the map, volcanic activity would most likely be found at —
60
Location X
Location W
Location Y
Location Z
28 questions
Q.
Students in a science class in Marfa, Texas, made a poster with a diagram to represent a seasonal change in the Northern Hemisphere. Which statement best describes conditions for Earth at Position 1 in the diagram?
1
60 sec
8.7a
Q.
The map shows some of Earth’s plate tectonic boundaries. Based on the map, volcanic activity would most likely be found at —
2
60 sec
8.9b
Q.
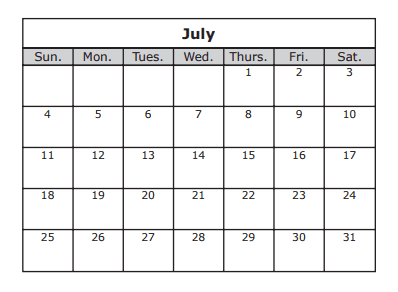
Two friends want to go for a night hike when there is a full moon in July. If there is a third-quarter moon on July 2, what is the approximate date of the next full moon?
3
60 sec
8.7b
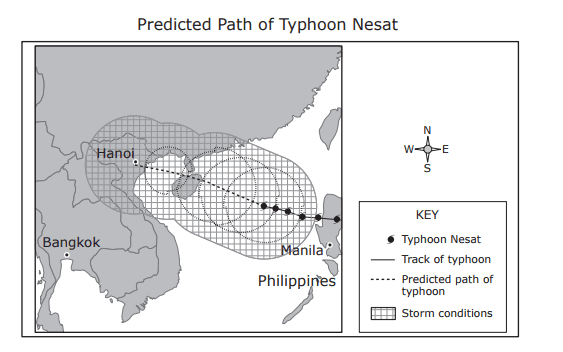
Q.
In 2011, Typhoon Nesat struck the Philippines and caused widespread flooding. After hitting the Philippines, Typhoon Nesat was predicted to hit the large city of Hanoi, Vietnam. If Typhoon Nesat had continued along the same path, which development would most likely have reduced its strength before it hit Hanoi?
4
60 sec
8.10c
Q.
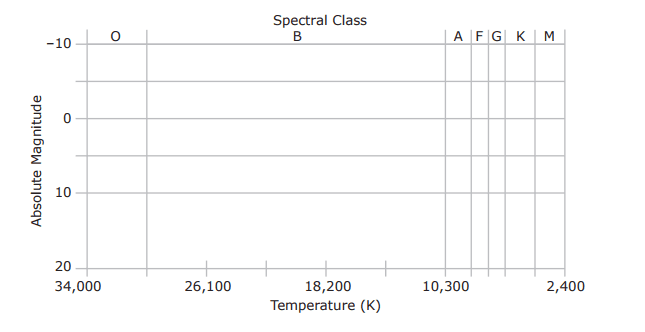
Barnard’s Star is about 5.9 light-years from the sun. The star has an approximate temperature of 2,800 K. Based on the diagram, what spectral class does Barnard’s Star belong to?
5
60 sec
8.8a
Q.
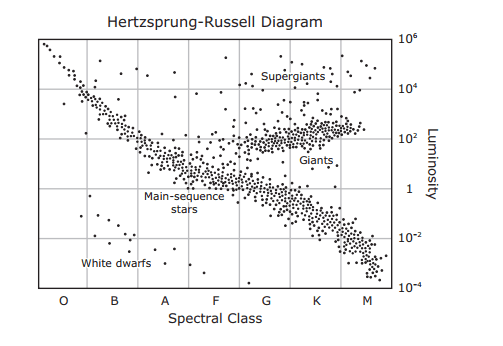
A Hertzsprung-Russell diagram is shown below. Based on this diagram, which type of stars would belong to spectral class M and have the highest luminosity?
6
60 sec
8.8a
Q.
Scientists recently discovered that rocks collected from the Franklin Mountains in West Texas and rocks collected from mountains in eastern Antarctica were exactly the same age. Further research showed that the rocks were chemically and geologically the same and came from the same magma source. This discovery provides evidence of —
7
60 sec
8.9a
Q.
The satellite image below shows a ship channel between South Padre Island and Boca Chica beach in South Texas. Sand is sometimes removed from the ship channel through a process called dredging to make it easier for ships to travel through. Recently sand from the bottom of the channel was moved to area beaches. Without this transfer of sand, what would most likely occur in this area in the future?
8
60 sec
8.9c
Q.
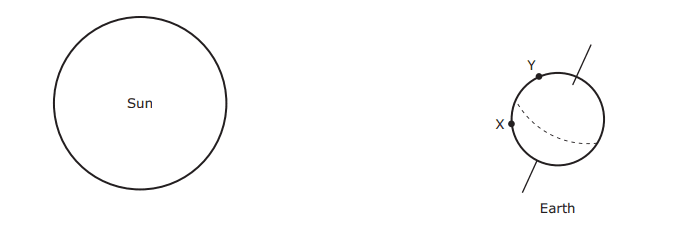
A student draws the model shown below. Which of these best compares the conditions at Location X and Location Y?
9
60 sec
8.7a
Q.
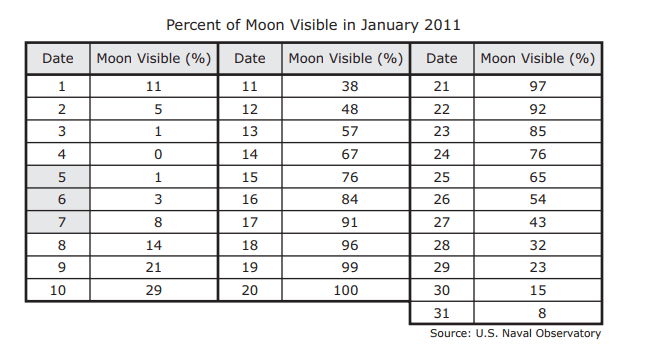
Some students used records from the U.S. Naval Observatory to make the table below of the percent of the moon that was visible on each night in January 2011. Based on these data, what part of the lunar cycle occurred between January 5 and January 7?
10
60 sec
8.7b
Q.
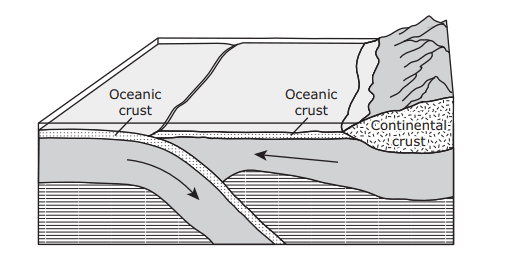
The diagram below shows a model of the movement of two tectonic plates. When the plates collide, one plate often moves below the other plate. The rising magma that can result from this type of plate movement may produce —
11
60 sec
8.9b
Q.
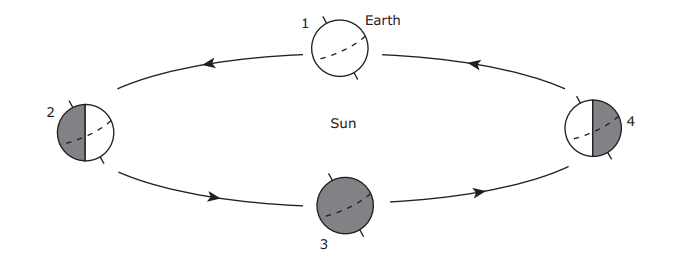
The diagram below shows four positions in Earth’s orbit around the sun. The Northern Hemisphere experiences the beginning of spring when Earth is in —
12
60 sec
8.7a
Q.
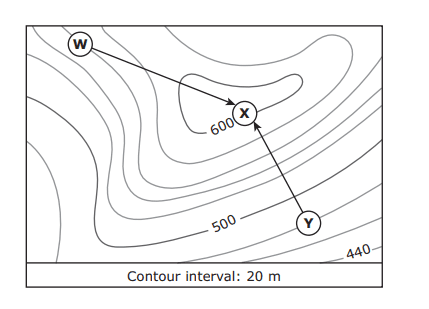
The points labeled W and Y on the topographic map below show the campsites of two families. Each family hiked to the elevation on the map marked X. The arrows show the paths taken by both families. What was the change in elevation, to the nearest ten meters, for the family that took the steepest path to Point X? Be sure to use the correct place value.
13
60 sec
8.9c
Q.
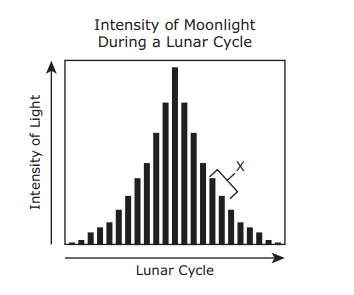
The moon reflects different amounts of sunlight onto Earth at different times. This reflected sunlight is commonly called moonlight. The graph below shows the intensity of moonlight at different times in a lunar cycle. Which moon phase most likely occurs at the time in the cycle represented by an X on the graph?
14
60 sec
8.7b
Q.
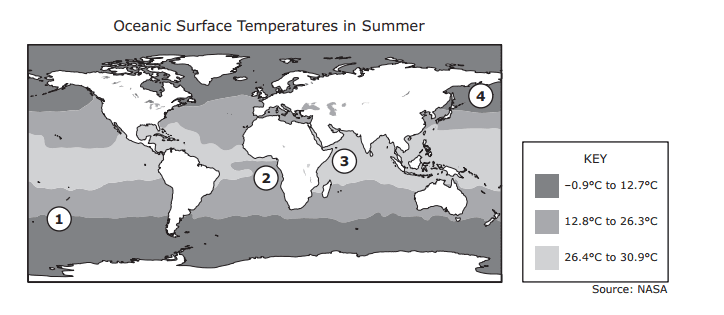
Hurricanes and similar storm systems begin over oceans. The map below shows average surface temperatures of the oceans in the summer. Based on the map, which area probably produced the most violent storm systems?
15
60 sec
8.10c
Q.
Four students are asked to describe a nebula and a star. Their responses are shown in the table below. Which student described these two celestial bodies correctly?
16
60 sec
8.8a
Q.
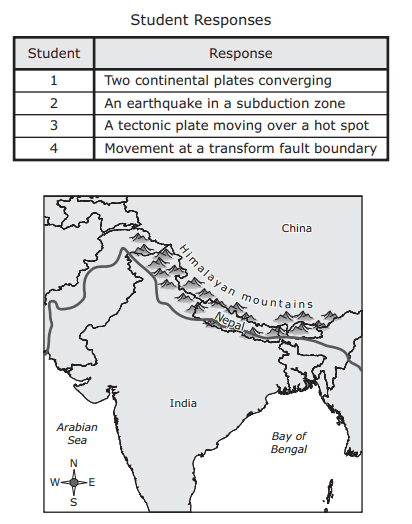
The Himalayan mountains are shown on the map below. Four students were asked to identify the geologic process that caused this mountain range to form. Their responses are shown below. Which student correctly identified the geologic process that formed the Himalayan mountains?
17
60 sec
8.9b
Q.
With the use of the Hubble Space Telescope, scientists recently discovered a giant runaway star. It is 90 times larger than the sun and is very hot and blue-white in color. Why does the sun appear to be brighter than this runaway star when viewed from Earth?
18
60 sec
8.8b
Q.
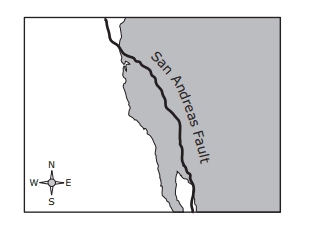
The San Andreas fault is a transform fault. The map below shows a student’s approximation of where the fault line crosses through the United States. Students were asked to make maps predicting which way land would most likely move over thousands of years. Which map best predicts the likely movement of land along the fault line over thousands of years?
19
60 sec
8.9b
Q.
Which of these changes would likely occur if the rate of Earth’s rotation on its axis increased?
20
60 sec
8.7a
Q.
The Hertzsprung-Russell diagram shows how the sun is classified among the stars. A star that is several thousand times brighter than the sun with a temperature lower than 4,000 K would be classified as —
21
60 sec
8.8a
Q.
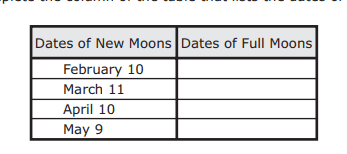
A student must complete the column of the table that lists the dates of the full moons. What are the most likely dates of the full moons?
22
60 sec
8.7b
Q.
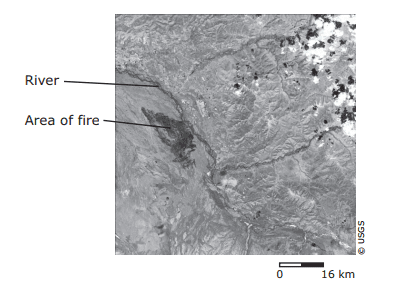
This satellite photograph shows an area in Alaska after a fire occurred. Which statement best describes the most likely effect the fire had on the river in the 12 months after it occurred?
23
60 sec
8.9c
Q.
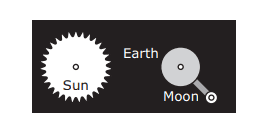
A student uses paper and fasteners to create a model of Earth, the sun, and the moon. The sun and Earth are attached to the paper background, while the moon is free to revolve around Earth. Which diagram shows the objects arranged so that a new moon would be visible from Earth?
24
60 sec
8.7b
Q.
The universe has many different components. Which list places four components of the universe in the most likely order from smallest to largest?
25
60 sec
8.8a
Q.
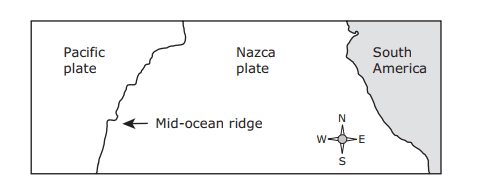
A mid-ocean ridge separates the Pacific plate and the Nazca plate off the western coast of South America. Which statement best describes the relative motions of the Pacific and Nazca plates?
26
60 sec
8.9b
Q.
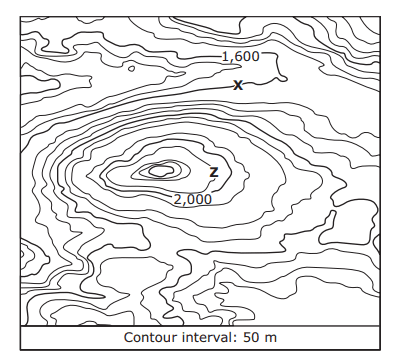
The topographic map shows the location of a park ranger at Point X when a message is received that an injured hiker needs help at Point Z. Which of these is closest to the difference in elevation between the locations of the ranger and the injured hiker?
27
60 sec
8.9c
Q.
The model shows Earth in several positions relative to the sun. In which position is it winter in North America?