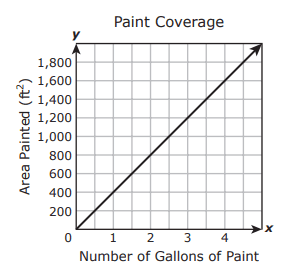
Write and solve equations involving direct variation.
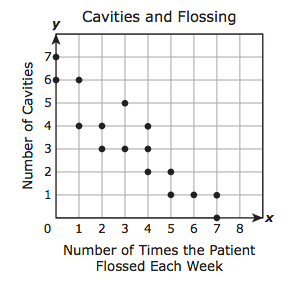
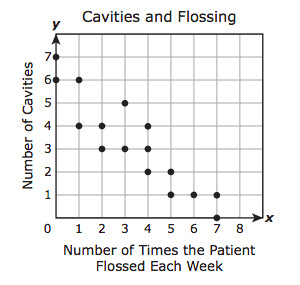
Calculate, using technology, the correlation coefficient between two quantitative variables and interpret this quantity as a measure of the strength of the linear association.
Solve systems of two linear equations with two variables for mathematical and real-world problems.
Compare and contrast association and causation in real-world problems.
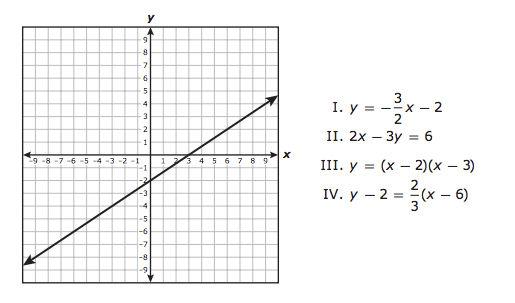
Write linear equations in two variables in various forms, including y = mx + b, Ax + By = C, and y - y1 = m(x - x1), given one point and the slope and given two points.
Write, with and without technology, linear functions that provide a reasonable fit to data to estimate solutions and make predictions for real-world problems.
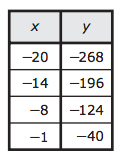
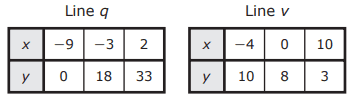
Determine the slope of a line given a table of values, a graph, two points on the line, and an equation written in various forms, including y = mx + b, Ax + By = C, and y - y1 = m(x - x1).
Determine the domain and range of a linear function in mathematical problems; determine reasonable domain and range values for real-world situations, both continuous and discrete; and represent domain and range using inequalities.
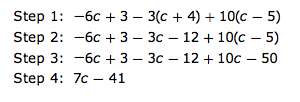
Solve linear inequalities in one variable, including those for which the application of the distributive property is necessary and for which variables are included on both sides.
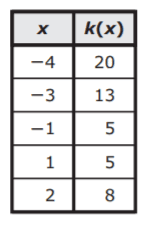
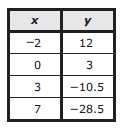
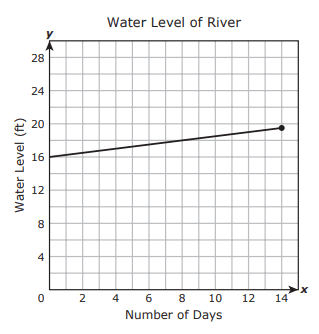
Calculate the rate of change of a linear function represented tabularly, graphically, or algebraically in context of mathematical and real-world problems.
Write linear equations in two variables given a table of values, a graph, and a verbal description.
Write linear inequalities in two variables given a table of values, a graph, and a verbal description.
Graph the solution set of linear inequalities in two variables on the coordinate plane.
Solve linear equations in one variable, including those for which the application of the distributive property is necessary and for which variables are included on both sides.
Determine the effects on the graph of the parent function f(x) = x when f(x) is replaced by af(x), f(x) + d, f(x - c), f(bx) for specific values of a, b, c, and d.
Write systems of two linear equations given a table of values, a graph, and a verbal description.
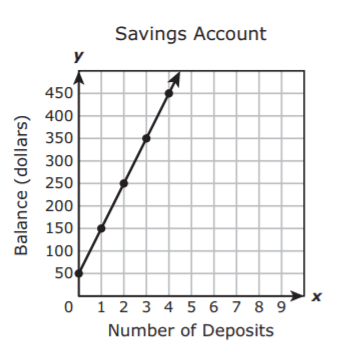
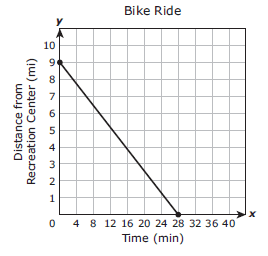
Graph linear functions on the coordinate plane and identify key features, including x-intercept, y-intercept, zeros, and slope, in mathematical and real-world problems.
Graph systems of two linear equations in two variables on the coordinate plane and determine the solutions if they exist.
Write an equation of a line that is parallel or perpendicular to the X or Y axis and determine whether the slope of the line is zero or undefined.
Write the equation of a line that contains a given point and is perpendicular to a given line.
Track each student's skills and progress in your Mastery dashboards