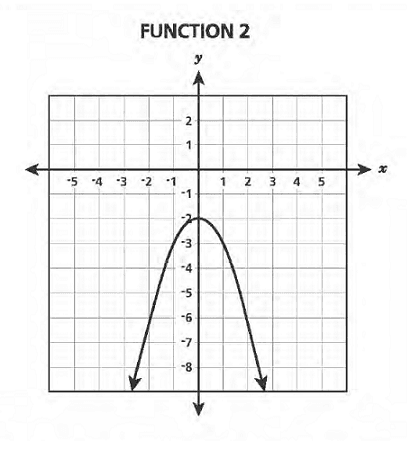
Describe qualitatively the functional relationship between two quantities by analyzing a graph (e.g., where the function is increasing or decreasing, linear or nonlinear). Sketch a graph that exhibits the qualitative features of a function that has been described verbally.
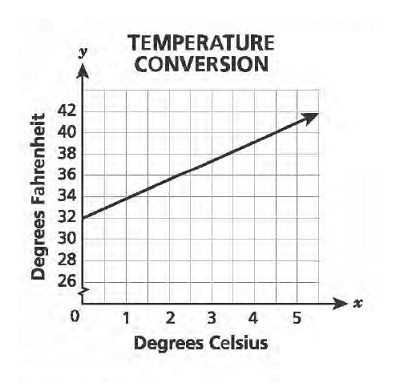
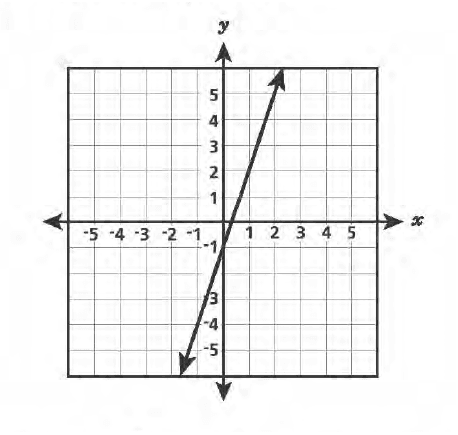
Construct a function to model a linear relationship between two quantities. Determine the rate of change and initial value of the function from a description of a relationship or from two (x, y) values, including reading these from a table or from a graph. Interpret the rate of change and initial value of a linear function in terms of the situation it models, and in terms of its graph or a table of values.
Understand that a function is a rule that assigns to each input exactly one output. The graph of a function is the set of ordered pairs consisting of an input and the corresponding output
Track each student's skills and progress in your Mastery dashboards
Give this quiz to my class
Q 1/36
Score 0
60
Q 2/36
Score 0
60
36 questions
Q.
1
60 sec
8.F.A.3
Q.
2
60 sec
8.F.B.5
Q.
3
60 sec
8.F.B.4
Q.
4
60 sec
8.F.A.2
Q.
5
60 sec
8.F.B.5
Q.
6
60 sec
8.F.B.4
Q.
7
60 sec
8.F.A.3
Q.
8
60 sec
8.F.A.2
Q.
Which set of ordered pairs represents a function?
9
60 sec
8.F.A.1
Q.
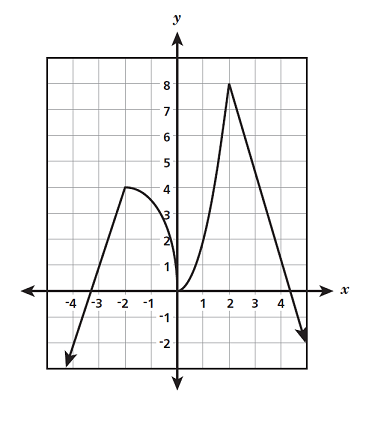
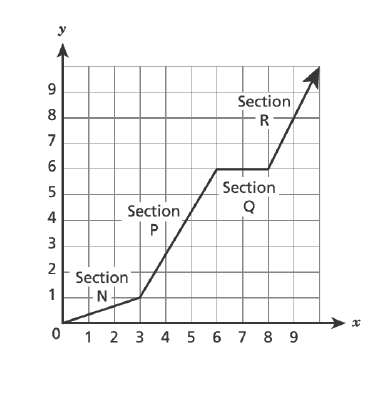
The graph of a function is shown below.
Which statement is true about a section of the graph?
10
60 sec
8.F.B.5
Q.
11
60 sec
8.F.A.1
Q.
12
60 sec
8.F.B.4
Q.
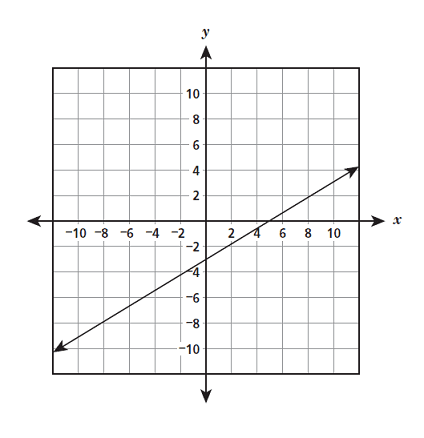
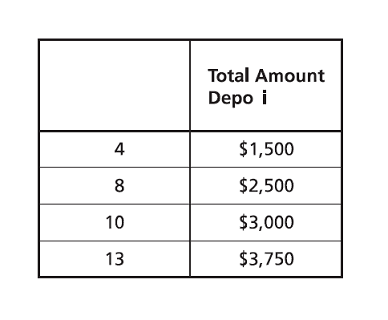
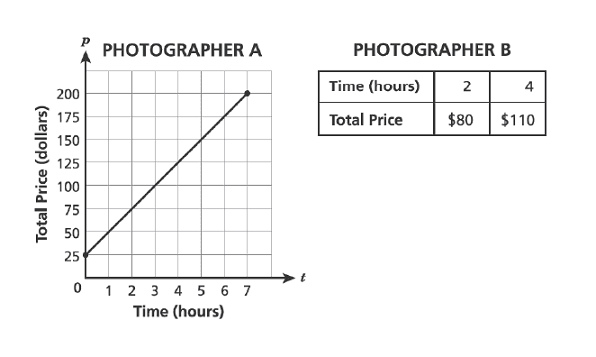
Two photographers offer different pricing plans for their services. The graph below models the prices Photographer A charges. The table below shows the prices Photographer B charges. Each photographer charges a one-time equipment fee and an hourly rate.
Which statement about the two pricing plans is true?
13
60 sec
8.F.A.2
Q.
14
60 sec
8.F.A.3
Q.
15
60 sec
8.F.A.1
Q.
16
60 sec
8.F.A.3
Q.
17
60 sec
8.F.A.3
Q.
18
60 sec
8.F.A.2
Q.
19
60 sec
8.F.A.2
Q.
20
60 sec
8.F.B.5
Q.
21
60 sec
8.F.A.3
Q.
A linear function models the cost based on the number of toothbrushes made. Which statement about the rate of change of this function is true?
22
60 sec
8.F.B.4
Q.
23
60 sec
8.F.A.3
Q.
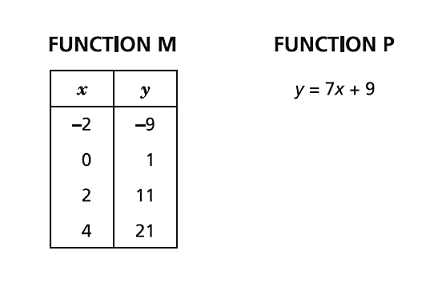
Linear functions M and P are shown below.
In comparing the rates of change, which statement about Function M and Function P is true?
24
60 sec
8.F.A.2
Q.
25
60 sec
8.F.B.5
Q.
26
60 sec
8.F.A.1
Q.
27
60 sec
8.F.A.1
Q.
28
60 sec
8.F.B.4
Q.
29
60 sec
8.F.A.3
Q.
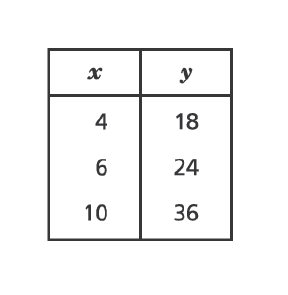
Which table of values represents a linear function?
30
60 sec
8.F.A.3
Q.
31
60 sec
8.F.A.2
Q.
Which table represents a relation that is NOT a function?