Feel free to use or edit a copy
includes Teacher and Student dashboards
Measures 9 skills from
Measures 9 skills from
Track each student's skills and progress in your Mastery dashboards
With a free account, teachers can
- edit the questions
- save a copy for later
- start a class game
- automatically assign follow-up activities based on students’ scores
- assign as homework
- share a link with colleagues
- print as a bubble sheet
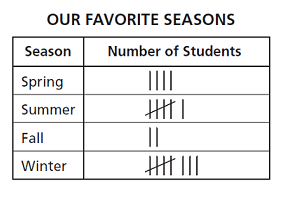
- Q 1/26Score 0The tally chart shows the favorite seasons of Mr. Slater's students. Which picture graph correctly shows the data?29


26 questions
Show answers
- Q1The tally chart shows the favorite seasons of Mr. Slater's students. Which picture graph correctly shows the data?60s3.MD.B.3
- Q260s3.MD.C.7.D
- Q360s3.MD.A.2
- Q4Mr. Stone asked each of his students to name one favorite hobby. He made the picture graph to display the data. Which table represents the same data as the picture graph?60s3.MD.B.3
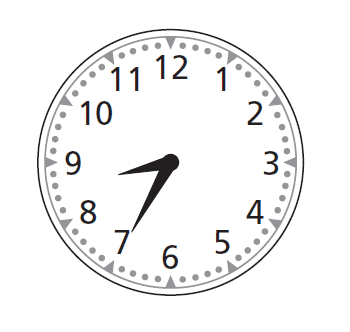
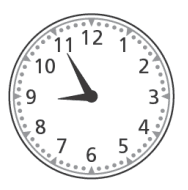
- Q5Pedro left home this morning at the time shown on the clock below. Tina left home 20 minutes after Pedro left. Carlos left home 18 minutes after Tina left. At what time did Carlos leave home this morning?7:57 a.m.8:38 a.m.9:13 a.m.8:13 a.m.60s3.MD.A.1
- Q660s3.MD.A.2
- Q760s3.MD.C.7.C
- Q860s3.MD.B.3
- Q960s3.MD.B.3
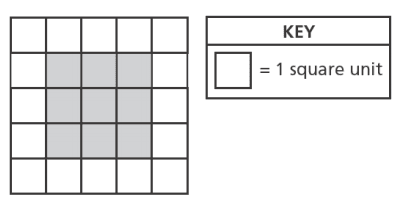
- Q1060s3.MD.C.5.B
- Q1160s3.MD.C.7.A
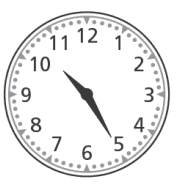
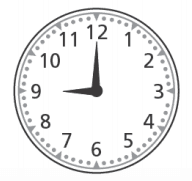
- Q12Frankie's music class begins at 9:40 a.m, The class is 45 minutess long. Which clock shows the time that Frankie's class ends?60s3.MD.A.1
- Q1360s3.MD.C.7.B
- Q1460s3.MD.C.6
- Q1560s3.MD.C.5.B