Topic Review: Measurement and Data
Quiz by Grade 7 Math - Texas Education Agency
Grade 7
Math (Archived)
Texas Essential Knowledge and Skills (TEKS)
Feel free to use or edit a copy
includes Teacher and Student dashboards
Measures 2 skills from
Measures 2 skills from
Track each student's skills and progress in your Mastery dashboards
With a free account, teachers can
- edit the questions
- save a copy for later
- start a class game
- automatically assign follow-up activities based on students’ scores
- assign as homework
- share a link with colleagues
- print as a bubble sheet
6 questions
Show answers
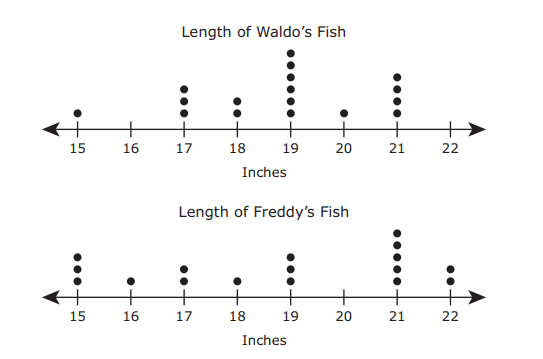
- Q1Waldo and Freddy caught fish one weekend. The dot plots show the lengths of the fish they caught. Which statement about the lengths of the fish caught by Waldo and Freddy appears to be true?The data for Waldo’s fish and the data for Freddy’s fish are approximately symmetrical.The range of the length of the fish caught by Freddy is greater than the range of the length of the fish caught by Waldo.The data for Waldo’s fish and the data for Freddy’s fish are skewed to the right.The median length of the fish caught by Waldo is greater than the median length of the fish caught by Freddy.60s7.12.A: Measurement and Data
- Q2Mrs. Kelso and Mr. Bonham gave each of their students a small bag of colored tiles. The students each counted the number of purple tiles they received. The box plots display the data for both classes. Which statement is best supported by the information in the box plots?The interquartile range of the data for Mrs. Kelso’s class is greater than the interquartile range of the data for Mr. Bonham’s class.The range of the data for Mr. Bonham’s class is less than the range of the data for Mrs. Kelso’s class.The median number of the data for Mr. Bonham’s class is less than the median number of the data for Mrs. Kelso’s class.The data for Mrs. Kelso’s class are more symmetrical than the data for Mr. Bonham’s class.60s7.12.A: Measurement and Data
- Q3The number of pets per household for Mrs. Anderson’s class and Mrs. Murphy’s class are shown in the dot plots. Here are three statements about the number of pets per household for these two classes. I. The range of the number of pets per household for Mrs. Murphy’s class is greater than the range of the number of pets per household for Mrs. Anderson’s class. II. The distribution of the data is approximately symmetrical in both sets of data. III. The mode of the number of pets per household for Mrs. Anderson’s class is equal to the mode of the number of pets per household for Mrs. Murphy’s class. Which of these three statements appear to be true?I and IIIIII onlyI onlyII and III60s7.12.A: Measurement and Data
- Q4The box plots show data about the number of years that farmworkers have been employed at each of two farms. Which statement is best supported by the information in the box plots?The median of the data for Farm Y is greater than the median of the data for Farm X.The third quartile of the data for Farm Y is less than the third quartile of the data for Farm X.The range of the data for Farm Y is equal to the range of the data for Farm X.The first quartile of the data for Farm Y is greater than the first quartile of the data for Farm X.60s7.12.A: Measurement and Data
- Q5The dot plots show the heights of the players on two basketball teams. Which statement is best supported by these data?The median height of the players on Team B is less than the median height of the players on Team A.The distributions of the data for Team A and Team B are approximately symmetrical.The mode height of the players on Team B is less than the mode height of the players on Team A.Team B has a greater range in player heights than Team A has.60s7.12.A: Measurement and Data
- Q6Parker conducted a random survey at the mall to determine the number of songs in each genre that were downloaded by 40 students. The results are shown in the bar graph. Based on the information in the graph, which inference about the general population of students is valid?More girls than boys like rock music.Girls like country music more than all other genres combined.Boys like rock music more than girls like rap music.Boys like country music more than rock music.60s7.12.C: Measurement and Data
