Topic Review: Proportionality (Part 1)
Quiz by Grade 7 Math - Texas Education Agency
Grade 7
Math (Archived)
Texas Essential Knowledge and Skills (TEKS)
Feel free to use or edit a copy
includes Teacher and Student dashboards
Measures 15 skills from
Measures 15 skills from
Track each student's skills and progress in your Mastery dashboards
With a free account, teachers can
- edit the questions
- save a copy for later
- start a class game
- automatically assign follow-up activities based on students’ scores
- assign as homework
- share a link with colleagues
- print as a bubble sheet
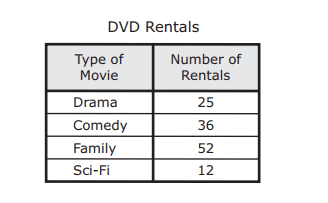
- Q 1/25Score 0The table shows the types of movies and the numbers of DVDs rented by customers at a store in one day. Based on the data in the table, what is the probability that a random customer will not rent a drama?291/5, because the probability of renting a drama is 4/54/5, because the probability of renting a drama is 1/53/4, because the probability of renting a drama is 1/41/4, because the probability of renting a drama is 3/4


25 questions
Show answers
- Q1The table shows the types of movies and the numbers of DVDs rented by customers at a store in one day. Based on the data in the table, what is the probability that a random customer will not rent a drama?1/5, because the probability of renting a drama is 4/54/5, because the probability of renting a drama is 1/53/4, because the probability of renting a drama is 1/41/4, because the probability of renting a drama is 3/460s7.6.E: Proportionality
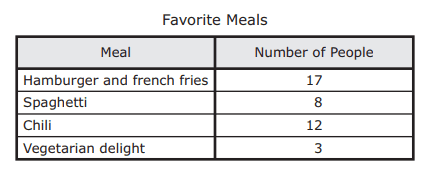
- Q2Deborah surveyed customers in a restaurant to find out their favorite meal. The results of the survey are shown in the table. One person in the restaurant will be picked at random. Based on the given information, which statement is true?This person’s favorite meal is four times as likely to be chili as it is to be vegetarian delight.This person’s favorite meal is twice as likely to be hamburger and french fries as it is to be spaghetti.This person’s favorite meal is equally likely to be either vegetarian delight or spaghetti.This person’s favorite meal is four times as likely to be chili as it is to be vegetarian delight.60s7.6.H: Proportionality
- Q3Mildred has a bag of coins. The bag contains 10 dimes, 5 nickels, and 1 penny. She will randomly select 2 coins from the bag one at a time without replacement. What is the probability that Mildred will select a dime first and then a penny?11/161/2483/1205/12860s7.6.I: Proportionality
- Q4Frank and his family drove 6 hours every day during a road trip. Which graph best represents y, the total number of hours driven in x days?#texas/c0a81159-6d57-4149-b65e-d5029707b7d0/B.png#texas/c0a81159-6d57-4149-b65e-d5029707b7d0/C.png#texas/c0a81159-6d57-4149-b65e-d5029707b7d0/A.png#texas/c0a81159-6d57-4149-b65e-d5029707b7d0/D.png60s7.4.A: Proportionality
- Q5The cost of 3 pounds of grapes is $6.57. What is the constant of proportionality that relates the cost in dollars, y, to the number of pounds of grapes, x?2.19Not here6.57360s7.4.C: Proportionality
- Q6Amanda increased the amount of protein she eats every day from 48 g to 54 g. By what percentage did Amanda increase the amount of protein she eats?12.50%11.10%88.90%112.50%60s7.4.D: Proportionality
- Q7Teri ran 8 kilometers. One mile is approximately equal to 1.6 kilometers. Which measurement is closest to the number of miles Teri ran?9.6 mi5 mi12.8 mi6.4 mi60s7.4.E: Proportionality
- Q8Which of these best describes π?The ratio of the radius of a circle to its diameterThe ratio of the circumference of a circle to its diameterThe square root of the area of a circleThe radius of a circle times 3.1460s7.5.B: Proportionality
- Q960s7.5.C: Proportionality
- Q1060s7.6.G: Proportionality
- Q11Tareq pays $22.10 for 2.6 pounds of salmon. What is the price per pound of the salmon?$24.70$8.50$57.46$19.5060s7.4.B: Proportionality
- Q1260s7.5.A: Proportionality
- Q13Bailey will roll a number cube and flip a coin for a probability experiment. The faces of the number cube are labeled 1 through 6. The coin can land on heads or tails. If Bailey rolls the number cube once and flips the coin once, which list contains only the outcomes in which the number cube lands on a number greater than 4?5, Heads 5, Tails 6, Heads 6, Tails1, Heads 1, Tails 2, Head 2, Tails 3, Heads 3, Tails 4, Heads 4, Tails 5, Heads 5, Tails 6, Heads 6, Tails4, Heads 4, Tails 5, Heads 5, Tails 6, Heads 6, Tails5, Heads 6, Tails60s7.6.A: Proportionality
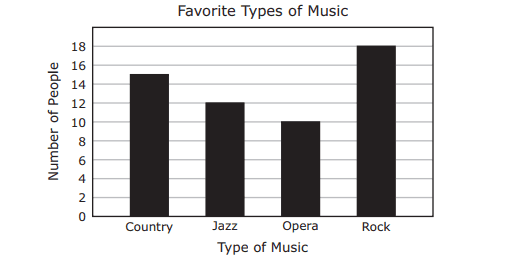
- Q14Maribel surveyed 55 people to find out their favorite types of music. The results are shown in the bar graph.Based on the information in the graph, which types of music were chosen by 40% of the people surveyed?Jazz and operaJazz, opera, and rockCountry and operaCountry, jazz, and rock60s7.6.G: Proportionality
- Q15Gabriel has these cans of soup in his kitchen cabinet. • 2 cans of tomato soup • 3 cans of chicken soup • 2 cans of cheese soup • 2 cans of potato soup • 1 can of beef soup Gabriel will randomly choose one can of soup. Then he will put it back and randomly choose another can of soup. What is the probability that he will choose a can of tomato soup and then a can of cheese soup?1/252/52/451/560s7.6.I: Proportionality