


Feel free to use or edit a copy
includes Teacher and Student dashboards
Measures 2 skills from
Measures 2 skills from
With a free account, teachers can
- edit the questions
- save a copy for later
- start a class game
- automatically assign follow-up activities based on students’ scores
- assign as homework
- share a link with colleagues
- print as a bubble sheet
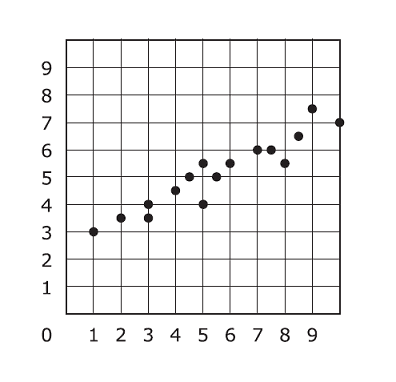
- Q 1/3Score 0A scatter plot is shown on the coordinate plane. Which of these most closely approximates a line of best fit for the data in the scatter plot? (*NO CALCULATOR*)29


3 questions
Show answers
- Q1A scatter plot is shown on the coordinate plane. Which of these most closely approximates a line of best fit for the data in the scatter plot? (*NO CALCULATOR*)30s8.SP.A.2
- Q230s8.SP.A.3
- Q3Users enter free textType an Answer30s8.SP.A.3