


TQM QUIZ FOR EMPLOYEES
Quiz by ANIKET PANDEY
Feel free to use or edit a copy
includes Teacher and Student dashboards
Measure skillsfrom any curriculum
Tag the questions with any skills you have. Your dashboard will track each student's mastery of each skill.
- edit the questions
- save a copy for later
- start a class game
- automatically assign follow-up activities based on students’ scores
- assign as homework
- share a link with colleagues
- print as a bubble sheet
- Q 1/10Score 0
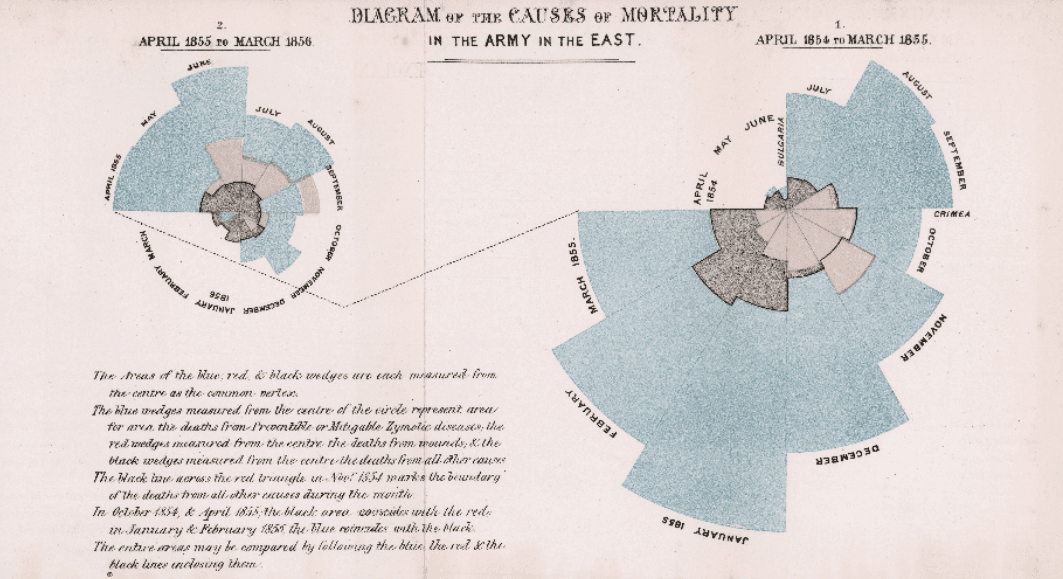
Attached Chart compares the Causes of mortality in the army for the year FY 1854-55 & FY 1855-56. Identify the type of chart (Currently named as Pie chart)
29Radar chart
Polar area diagram
Minard map
Circular Histogram


- Q1
Attached Chart compares the Causes of mortality in the army for the year FY 1854-55 & FY 1855-56. Identify the type of chart (Currently named as Pie chart)
Radar chart
Polar area diagram
Minard map
Circular Histogram
30s - Q2
“Genchi Genbutsu” method is effectively used for which of the below analysis.
Safety observation
Incident investigation
Tool box talk
Fault tree analysis
30s - Q3
Identify the Performance loss
Speed loss
Setup & adjustment loss
Operator motion loss
Startup loss
30s - Q4
Recommended Process capability for one sided specification.
1.33
1.67
1.25
2
30s - Q5
ESG principle ensures that actions are initiated to
Lower Pollution
Lower CO2 emission
Increasing the public trust.
All of the above
Option (a) & (b)
30s - Q6
In Kano Model, Fulfilling the Customers “Must” needs are
Normal Quality
Expected quality
Exciting Quality
Total Quality
30s - Q7
The other name of Production Planning Matrix
Process Flow chart
PERT Chart
House of Quality
Capacity planning
30s - Q8
The term “Action Priority” (AP) is related to which document.
Control Plan
FMEA
HIRA
Aspect & Impact register
30s - Q9
In orthogonal array table (L8 (2) 7), value 7 refers to
Number of levels
Number of experiments
Number of Rows
Number of Columns
30s - Q10
Data set consists of the numbers 4, 10, 12, 7, 19, 10, 5, and x. For what value of x will the mode, the median, and the mean all be equal?
13
17
21
42
30s