Loading...
Tuesday Exit Ticket
Quiz by Karina Garcia
Track each student's skills and progress in your Mastery dashboards
What does the key mean? (Hint use Exit ticket for help)

6|1 means 61 runs
6|1 means 6.1 runs
6|1 means 611 runs
6|1 means 6 1/10 runs
Which correctly represents the values in order from least to greatest

61, 92, 100, 65, 72, 64, 84
61, 64, 65, 72, 84, 92, 100
61, 72, 64, 84, 64, 92, 100
What does the key mean? (Hint use Exit ticket for help)

Which correctly represents the values in order from least to greatest
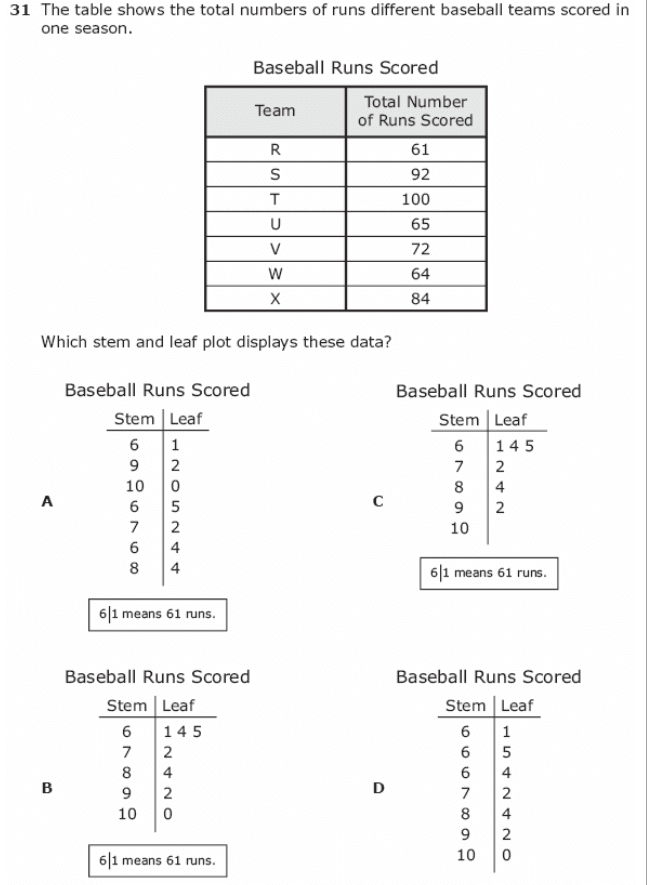
Which stem and leaf plot displays these data?

What does the key on the stem and leaf plot mean?
Which correctly represents the values in order from least to greatest?
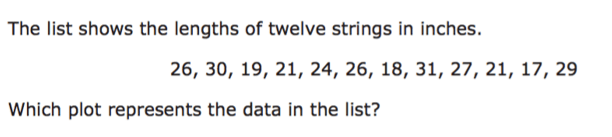
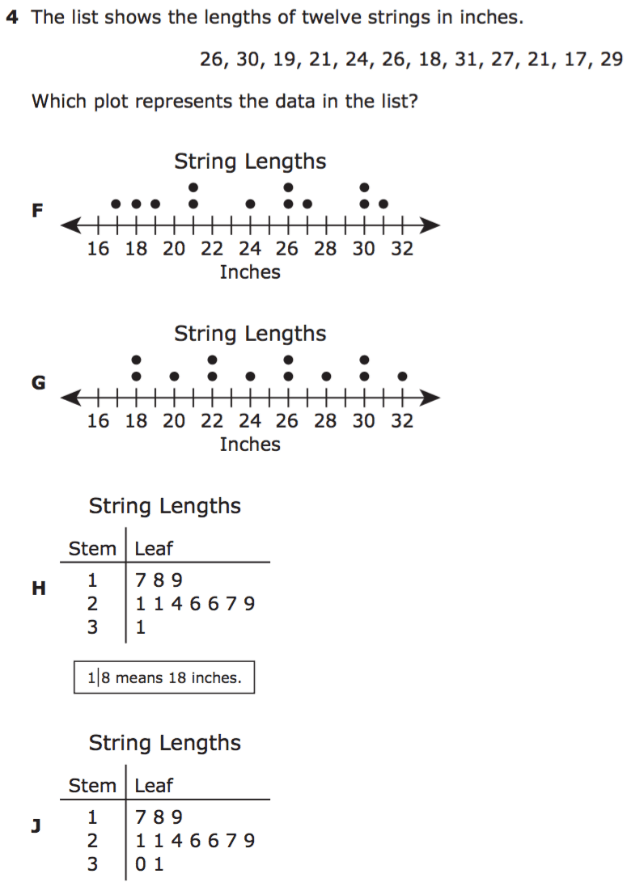
Which plot represents the data in the list?