Loading...


Types of Slope
Quiz by Amber Benson
Customize this quiz to suit your class
Instantly translate to 100+ languages
Tag the questions with any skills you have. Your dashboard will track each student's mastery of each skill.
Give this quiz to my class
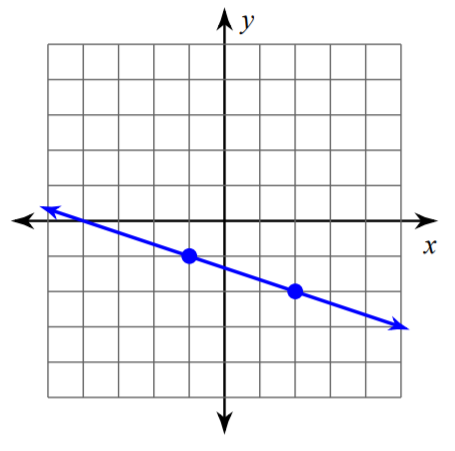
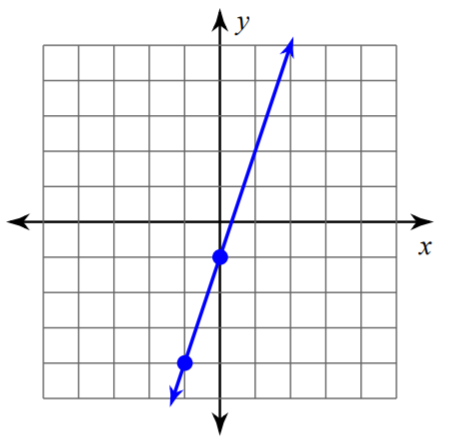
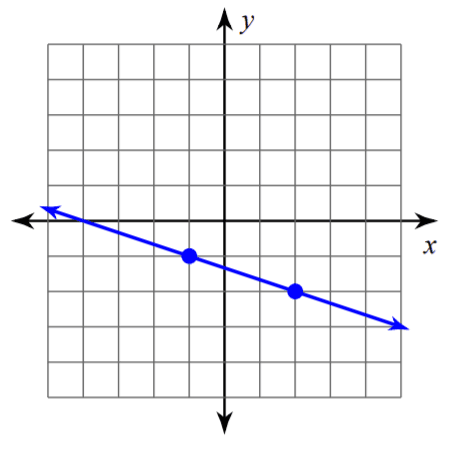
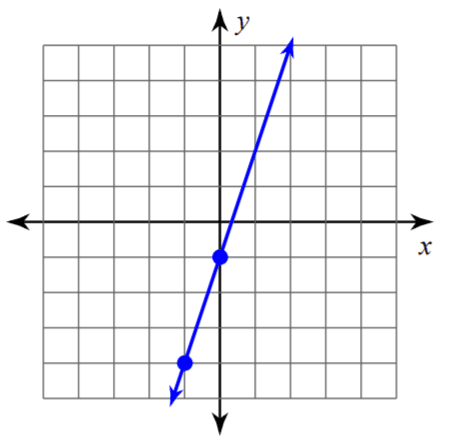
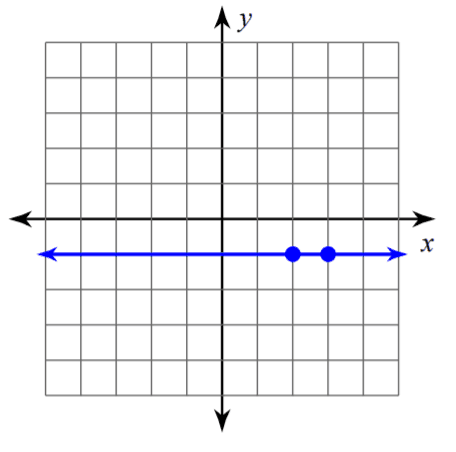
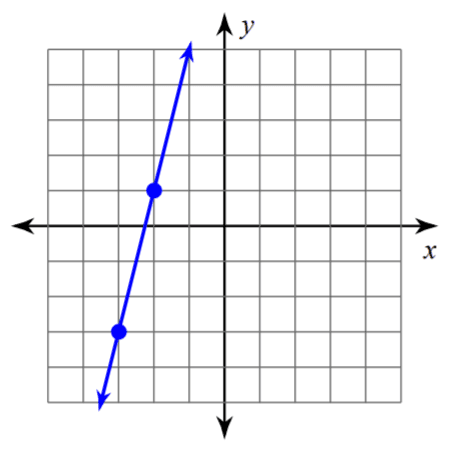
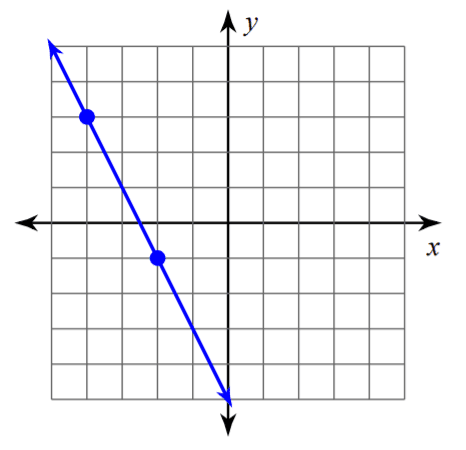
 Test your knowledge on Types of Slopes/Gradient(kinematics)Continental Drift Theory. From the discussion of the rock cycle, it has been pointed out that through Earth's external and internal processes. Earth's surface is constantly changing. However, this idea of a changing environment did not conform with the belief of earlier scientists. Rather, they thought that the geographic positions of ocean basins and continents have been static since the beginning of time. It was around the 1500s when Leonardo da Vinci, upon his discovery of fossil seashells found at the high mountains of Italy, first thought of the idea that the areas where mountains are located may have been oceans in the past. Through time, other fossils of marine organisms found far above the current sea level further supported the idea that mountains were uplifted and weathering wore them down. At around the 1800s, most scientists have accepted the idea that Earth's crust is undergoing large vertical movements or uplifting. There was also evidence of possible horizontal movements, but the scientists then were not convinced about it. Alfred Wegener showed evidence of horizontal or lateral movement of the continents in his continental drift theory. According to him, the continents have drifted around the world and have once formed a giant landmass or supercontinent called Pangaea. To support his theory, Alfred Wegener presented a set of geographical, biological, and climatic evidence.Wegener's geographical evidence included the jigsaw puzzle fit of the current continents. He pointed out that the coastlines of South America and Africa seem to fit together. He also pointed the presence of mountain ranges having similar rock types and age but separated by vast oceans, like that of the folded rocks of the Caledonian mountains. The same folded rocks run through West Africa, North America, Newfoundland, Ireland, Wales, Scotland, Greenland, and Norway, all of which are now separated by the Atlantic Ocean. A geographical evidence on the similar rock types in West Africa, North America, Greenland, and Europe is found. The biological evidence came in the discovery of similar plant and animal fossils in different continents separated by oceans. The animal fossils of Mesosaurus and Lystrosaurus indicate that they were not capable of crossing the oceans to reach the other continents. If they were, the fossils should have been more widely distributed Africa, Australia, India, and South America were too large to be carried by wind. This indicates that the areas where the fossils were found were closely linked. It has also been found out that the plant only grew in areas with subpolar climate, which would indicate that the landmasses were located near the South Pole.Lastly, for his climatic evidence, Wegener discovered that a glacial period occurred during the late Paleozoic era in Southern Africa, South America, Australia, and India. The initial explanation for this event was global cooling, but it was rejected because large tropical swamps with so much vegetation were found at the same time in the Northern Hemisphere. This further supported the idea that the supercontinent was indeed near the South Pole, and the continents in Northern Hemisphere were once near the equator. The glacial period also left glacial striations, or the scratches glaciers make as they move across on the underlying bedrock, on the aforementioned continents. For such an event to happen, the continents would have to be connected. SCIENCE PIONEER. Alfred Wegener (1880-1930). Alfred Wegener was a German polar researcher, geophysicist, and meteorologist. He was known for his work on the continental drift theory. In his effort to defend his work, he went to the Greenland ice sheet where he died.Even with all the compelling evidence, the continental drift theory hardly convinced the scientific community at that time because Wegener was unable to identify a credible mechanism that drives the continental drift. He was unable to clearly explain how the continents moved and how the larger continents broke through the ocean floor. Eventually, critics of the continental drift began to accept the theory when new evidence supporting the theory was discovered. The new evidence led to a more encompassing theory the theory of plate tectonics. This theory provided a more convincing explanation as to how the continents moved. The evidence that paved the way for the theory of plate tectonics was the idea of wandering poles. Scientists began studying volcanic rocks to determine the location of the magnetic poles. When volcanic rocks crystallize, the minerals with magnetic properties align themselves parallel to Earth's magnetic field at the time the minerals were formed. This finding allowed scientists to determine the polarity of Earth's magnetic field and the magnetic inclination that showed the location of the poles. Upon studying the paleomagnetism of the rocks, geophysicists found out that rocks from various locations point to different magnetic north poles, suggesting that the poles have wandered. Since movement of magnetic poles is very unlikely, scientists have accepted the idea that the continents are indeed moving. And if the continents are moving, scientists thought that maybe the ocean basins are moving too. They also discovered that some rocks showed magnetic reversals, which led them to believe that the magnetic north pole now was not always the magnetic north pole. Seafloor Spreading. After World War II, exploration on the ocean floor became the focus of many geologic studies. It was only then that the ocean ridge system was discovered. A geologist in Princeton University named Harry Hess, along with other scientists, studied this ocean ridge system and hypothesized that the oceanic crust was moving away from the ridge. His hypothesis, known as seafloor spreading, showed that the ocean floor is split along the ridge where the magma rises to form the new ocean floor.Because of this, rocks located near the ridge are younger than those that are located magnetic polarity of Earth is also preserved in those rocks. Withe ridge scientists were able to see the magnetic reversals in the ocean floor, and they were able to make use of information to determine that the ocean floor is moving at a rate of about 10 cm per year. Plate Tectonics. Confirmation of the seafloor spreading hypothesis proved that continents are not moving above the ocean floor. Rather, it is the fragments of the lithosphere. The lithosphere is the rigid layer that is composed of the uppermost mantle and the crust that carry the continents and the ocean basins along. These fragments of the lithosphere are called plates. Underneath the lithosphere is a weaker region in the mantle known as asthenosphere that behaves like a fluid. Thus, the lithosphere floats above the asthenosphere, making it detached and free to move. This became the basis of the theory of plate tectonics. Now that it has been made clear that it is the plates which are moving, the question as to how they move remained. Sir Arthur Holmes proposed the driving force for this plate movement in 1919. He suggested that the movement in the mantle carries the plates along. It was previously discussed that Earth's interior is very hot due to the heat produced by radioactive decay. Convection takes place in the mantle, keeping the asthenosphere hot and weak. The convection currents produced in the asthenosphere are the ones carrying the lithospheric plates and making them move. However, convection currents are not enough. Mechanisms such as ridge push and slab pull aid the convection currents to slowly move the lithospheric plates. Ridge push occurs at mid ocean ridges which are higher in elevation than the surrounding trenches and abyssal plains. The new ocean floor from the ridge is hot and relatively thin. As it moves away from the ridge, it cools down and gets denser, heavier, and thicker. Below this cooling ocean floor is the asthenosphere, which is less dense. This area becomes a massive shear zone and the new ocean floor will effectively slide down the slope of the asthenosphere. When the plate collides with another plate with lesser density, the denser plate sinks and a subduction zone is formed. When the subducting plate sinks, it pulls on the rest of the plate behind it. These mechanisms explain the movement of the plates.Earth has seven major lithospheric plates that account for 94% of Earth's surface. These are the North American Plate, South American Plate, Pacific Plate, African Plate, Eurasian Plate, Indo-Australian Plate, and Antarctic Plate. These plates are constantly moving relative to the other plates. Thus, the interaction of plates occurs mostly along the boundaries. These movements are plotted using information from earthquakes and volcanic activities. There are three main types of plate boundaries: convergent, divergent, and transform boundaries Convergent boundaries are boundaries where two plates move towards each other A convergent boundary is also known as destructive margin since this is where the collision between two plates occhins. There are three types of convergence-oceanic oceanic, oceanic-continental, and continental-continental. Trenches are features of the ocean floor that are present in both oceanic-oceanic boundary and oceanic-continental boundary. Subduction occurs at the trenches, therefore, these are characterized as the deepest parts of Earth. A divergent boundary is the opposite of convergent boundary: two plates move away from each other. Divergent boundaries create new crust; thus, they are also known as constructive margins. The ocean ridge system is a divergent boundary where new ocean floor is produced as magma rises, pushing the older rocks aside.Transform boundary is also known as conservative plate margin since two plates just move past one another, neither creating nor destroying land. Earthquake epicenters are usually detected at transform boundaries because the rocks tend to break and not fold or sink, like in convergent boundaries. Evolution of the Ocean Basins. Both the movement of the plates and seafloor are responsible for the evolution of ocean basins. Along the divergent boundary where ocean ridge systems are found, magma is released and new ocean floor is created. Along convergent boundaries, the ocean floor is being destroyed. The evolution of the ocean basins started during the time when Pangaea was still present and was surrounded by the vast ocean or superocean known as Panthalassa, also called Paleo-Pacific or "old Pacific." Upon the initial break up of Pangaea into Laurasia and Gondwanaland, the Tethys Sea began to form. Then, the Eurasian and North about, forming the North Atlantic. The South Atlantic only started to form when the African Plate and South American Plate separated. The continued movement of the plates created the Himalayas at one side and separated the Pacific Ocean and Atlantic Ocean at the other side, which consequently formed the current ocean basins. Both the movement of the plates and seafloor are responsible for the evolution of ocean basins. Along the divergent boundary where ocean ridge systems are found, magma is released and new ocean floor is created. Along convergent boundaries, the ocean floor is being destroyed. The evolution of the ocean basins started during the time when Pangaea was still present and was surrounded by the vast ocean or superocean known as Panthalassa, also called Paleo-Pacific or "old Pacific." Upon the initial break up of Pangaea into Laurasia and Gondwanaland, the Tethys Sea began to form. Then, the Eurasian and North about, forming the North Atlantic. The South Atlantic only started to form when the African Plate and South American Plate separated. The continued movement of the plates created the Himalayas at one side and separated the Pacific Ocean and Atlantic Ocean at the other side, which consequently formed the current ocean basins.Continents do not immediately end at the point where the ocean meets the land. They may extend slightly into the oceans. The portion of the continent that is submerged is called continental margin. There are two types of continental margin: passive margin and active margin. A passive continental margin consists of a continental shelf, continental slope, and continental rise. It is not associated with plate boundaries; thus, there are very little tectonic activities. An active continental margin only has a continental shelf and a continental slope. It is associated with plate boundaries; thus, a main feature of this boundary is a trench. The different features of a continental margin are the following: 1. The continental shelf is the gently-sloping submerged portion of the continent. 2. The continental slope is the steep slope after the continental shelf. It is still part of the continent. 3. The continental rise is the gently-sloping area after the continental slope and before the ocean floor. 4. The trenches are the deepest parts of the ocean. These are narrow depressions caused by the subduction of the ocean floor along the convergent boundaries. 5. The mid-oceanic ridge is the mountain range system in the ocean. It is responsible for the production of new ocean floor. This is the region where new magma constantly emerges from. SCIENCE CAREER. A scientific illustrator uses art to inform and communicate complex details and concepts of science. He/She makes use of scientifically informed observations and research along with his/her technical art and aesthetic skills to make accurate representations. In Natural History, the scientific illustrators recreate how the extinct species look like by working with scientists and fossil records. Moreover, with the advances in technology, illustrators are now into 3D modelling, animation, and video making. Earth's History. All the processes that have been discussed require long periods of time to create a noticeable change on Earth's surface. You can just imagine how long it would take to create an oceanas vast as the Pacific Ocean if the ocean floor moves only at about 10 cm/year. It is then important to know the history of Earth to learn the complexities of its past and be able to use it to understand the present. Just like learning the history of a country that requires one to read a lot of books, learning the history of Earth involves studying a lot of rocks. Rocks, especially sedimentary rocks, contain a lot of information about Earth's past. It holds the key to most of the geologic processes that happened on Earth and the key to uncovering how life on Earth evolved. But these discoveries are worthless if there is no time perspective. Thus, one of the most important contributions of geologists to mankind is the geologic time scale, which holds a history that is exceedingly long.Volcanic Eruptions Earthquakes are sometimes used in predicting volcanic eruptions. An earthquake alerts the authorities to observe a nearby volcano. When a volcano shows signs of eruption, evacuation of the nearby villages should be immediately implemented Active volcanoes are the ones that are usually closely monitored by volcanologists These are commonly located along plate boundaries specifically along the Pacific Ring of Fire. The Philippines is one of the countries that have a lot of volcanoes. The Pacific Ring of Fire is a region in the Pacific where most active volcanoes are located. The dots in the figure represent the active volcanoes in the world. Active volcanoes are those that have a recorded volcanic eruption in their history. There are two types of volcanic eruptions depending on the magma composition: the explosive type and the Hawaiian or nonexplosive type. The types of eruptions depend on the viscosity and amount of dissolved gases in a magma. Explosive eruptions have magma that is highly viscous and contains large amounts of dissolved gases. On the other hand, the Hawaiian type or nonexplosive eruptions have magma that has low viscosity and low amount of dissolved gases. Viscosity determines the ability of magma to flow. The lower the viscosity, the easier it is for the magma to flow. This viscosity of the magma is affected by silica content and temperature. Low-temperature magma with high silica content are highly viscous, high-temperature magma with low silica content has low viscosity. Therefore, in explosive eruptions, the magma could not easily get out of the vent. This impedes the remaining magma below, causing an increase of pressure. Once the pressure is released. an explosive eruption occurs. Volcanic Hazards Explosive volcanic eruptions release pyroclastic flows and materials that are considered to pose the greatest threat. The pyroclastic flows often render people in a shock state since they become overwhelmed with what they are seeing Too much pyroclastic material (eg., tephra), may bury people and severely damage the agricultural land and livestock. Damaged agricultural land could lead to famine. After an eruption, pyroclastic materials that have settled along the slope of the volcano get mixed with rainwater. This would start a mudflow or lahar moving at high speed, destroying everything along its path. Poisonous gases are also released by volcanoes. These gases can be lethal to people, animals, and plants. Just like earthquakes, violent volcanic eruptions may also happen underwater, which can trigger a tsunami. Introduction to Free Fall A free-falling object is an object that is falling under the sole influence of gravity. Any object that is being acted upon only by the force of gravity is said to be in a state of free fall. There are two important motion characteristics that are true of free-falling objects: • Free-falling objects do not encounter air resistance. • All free-falling objects (on Earth) accelerate downwards at a rate of 9.8 m/s/s (often approximated as 10 m/s/s for back-of-the-envelope calculations) Because free-falling objects are accelerating downwards at a rate of 9.8 m/s/s, a ticker tape trace or dot diagram of its motion would depict an acceleration. The dot diagram at the right depicts the acceleration of a free-falling object. The position of the object at regular time intervals - say, every 0.1 second - is shown. The fact that the distance that the object travels every interval of time is increasing is a sure sign that the ball is speeding up as it falls downward. Recall from an earlier lesson, that if an object travels downward and speeds up, then its acceleration is downward. Free-fall acceleration is often witnessed in a physics classroom by means of an ever-popular strobe light demonstration. The room is darkened and a jug full of water is connected by a tube to a medicine dropper. The dropper drips water and the strobe illuminate the falling droplets at a regular rate - say once every 0.2 seconds. Instead of seeing a stream of water free-falling from the medicine dropper, several consecutive drops with increasing separation distance are seen. The pattern of drops resembles the dot diagram shown in the graphic at the right. The Acceleration of Gravity It was learned in the previous part of this lesson that a free-falling object is an object that is falling under the sole influence of gravity. A free-falling object has an acceleration of 9.8 m/s/s, downward (on Earth). This numerical value for the acceleration of a free-falling object is such an important value that it is given a special name. It is known as the acceleration of gravity - the acceleration for any object moving under the sole influence of gravity. A matter of fact, this quantity known as the acceleration of gravity is such an important quantity that physicists have a special symbol to denote it - the symbol g. The numerical value for the acceleration of gravity is most accurately known as 9.8 m/s2. There are slight variations in this numerical value (to the second decimal place) that are dependent primarily upon on altitude. We will occasionally use the approximated value of 10 m/s2 in order to reduce the complexity of the many mathematical tasks that we will perform with this number. By so doing, we will be able to better focus on the conceptual nature of physics without too much of a sacrifice in numerical accuracy. g = 9.8 m/s2, downward Look It Up! Even on the surface of the Earth, there are local variations in the value of the acceleration of gravity (g). These variations are due to latitude, altitude and the local geological structure of the region. Recall from an earlier lesson that acceleration is the rate at which an object changes its velocity. It is the ratio of velocity change to time between any two points in an object's path. To accelerate at 9.8 m/s2 means to change the velocity by 9.8 m/s each second. If the velocity and time for a free-falling object being dropped from a position of rest were tabulated, then one would note the following pattern. Time (s) Velocity (m/s) 0 0 1 - 9.8 2 - 19.6 3 - 29.4 4 - 39.2 5 - 49.0 . Observe that the velocity-time data above reveal that the object's velocity is changing by 9.8 m/s each consecutive second. That is, the free-falling object has an acceleration of approximately 9.8 m/s2. Another way to represent this acceleration of 9.8 m/s2 is to add numbers to our dot diagram that we saw earlier in this lesson. The velocity of the ball is seen to increase as depicted in the diagram at the right. (NOTE: The diagram is not drawn to scale - in two seconds, the object would drop considerably further than the distance from shoulder to toes.) Representing Free Fall by Graphs • Early in Lesson 1 it was mentioned that there are a variety of means of describing the motion of objects. One such means of describing the motion of objects is through the use of graphs - position versus time and velocity vs. time graphs. In this part of Lesson 5, the motion of a free-falling motion will be represented using these two basic types of graphs. Representing Free Fall by Position-Time Graphs A position versus time graph for a free-falling object is shown below. Observe that the line on the graph curves. As learned earlier, a curved line on a position versus time graph signifies an accelerated motion. Since a free-falling object is undergoing an acceleration (g = 9.8 m/s/s), it would be expected that its position-time graph would be curved. A further look at the position-time graph reveals that the object starts with a small velocity (slow) and finishes with a large velocity (fast). Since the slope of any position vs. time graph is the velocity of the object (as learned in Lesson 3), the small initial slope indicates a small initial velocity and the large final slope indicates a large final velocity. Finally, the negative slope of the line indicates a negative (i.e., downward) velocity. Representing Free Fall by Velocity-Time Graphs A velocity versus time graph for a free-falling object is shown below. Observe that the line on the graph is a straight, diagonal line. As learned earlier, a diagonal line on a velocity versus time graph signifies an accelerated motion. Since a free-falling object is undergoing an acceleration (g = 9,8 m/s/s, downward), it would be expected that its velocity-time graph would be diagonal. A further look at the velocity-time graph reveals that the object starts with a zero velocity (as read from the graph) and finishes with a large, negative velocity; that is, the object is moving in the negative direction and speeding up. An object that is moving in the negative direction and speeding up is said to have a negative acceleration (if necessary, review the vector nature of acceleration). Since the slope of any velocity versus time graph is the acceleration of the object (as learned in Lesson 4), the constant, negative slope indicates a constant, negative acceleration. This analysis of the slope on the graph is consistent with the motion of a free-falling object - an object moving with a constant acceleration of 9.8 m/s/s in the downward direction. The Kinematic Equations The goal of this first unit has been to investigate the variety of means by which the motion of objects can be described. The variety of representations that we have investigated includes verbal representations, pictorial representations, numerical representations, and graphical representations (position-time graphs and velocity-time graphs). In Lesson 6, we will investigate the use of equations to describe and represent the motion of objects. These equations are known as kinematic equations. There are a variety of quantities associated with the motion of objects - displacement (and distance), velocity (and speed), acceleration, and time. Knowledge of each of these quantities provides descriptive information about an object's motion. For example, if a car is known to move with a constant velocity of 22.0 m/s, North for 12.0 seconds for a northward displacement of 264 meters, then the motion of the car is fully described. And if a second car is known to accelerate from a rest position with an eastward acceleration of 3.0 m/s2 for a time of 8.0 seconds, providing a final velocity of 24 m/s, East and an eastward displacement of 96 meters, then the motion of this car is fully described. These two statements provide a complete description of the motion of an object. However, such completeness is not always known. It is often the case that only a few parameters of an object's motion are known, while the rest are unknown. For example as you approach the stoplight, you might know that your car has a velocity of 22 m/s, East and is capable of a skidding acceleration of 8.0 m/s2, West. However you do not know the displacement that your car would experience if you were to slam on your brakes and skid to a stop; and you do not know the time required to skid to a stop. In such an instance as this, the unknown parameters can be determined using physics principles and mathematical equations (the kinematic equations). The BIG 4 The kinematic equations are a set of four equations that can be utilized to predict unknown information about an object's motion if other information is known. The equations can be utilized for any motion that can be described as being either a constant velocity motion (an acceleration of 0 m/s/s) or a constant acceleration motion. They can never be used over any time period during which the acceleration is changing. Each of the kinematic equations include four variables. If the values of three of the four variables are known, then the value of the fourth variable can be calculated. In this manner, the kinematic equations provide a useful means of predicting information about an object's motion if other information is known. For example, if the acceleration value and the initial and final velocity values of a skidding car is known, then the displacement of the car and the time can be predicted using the kinematic equations. Lesson 6 of this unit will focus upon the use of the kinematic equations to predict the numerical values of unknown quantities for an object's motion. The four kinematic equations that describe an object's motion are: There are a variety of symbols used in the above equations. Each symbol has its own specific meaning. The symbol d stands for the displacement of the object. The symbol t stands for the time for which the object moved. The symbol a stands for the acceleration of the object. And the symbol v stands for the velocity of the object; a subscript of i after the v (as in vi) indicates that the velocity value is the initial velocity value and a subscript of f (as in vf) indicates that the velocity value is the final velocity value. Each of these four equations appropriately describes the mathematical relationship between the parameters of an object's motion. As such, they can be used to predict unknown information about an object's motion if other information is known. In the next part of Lesson 6 we will investigate the process of doing this. Kinematic Equations and Problem-Solving The four kinematic equations that describe the mathematical relationship between the parameters that describe an object's motion were introduced in the previous part of Lesson 6. The four kinematic equations are: In the above equations, the symbol d stands for the displacement of the object. The symbol t stands for the time for which the object moved. The symbol a stand for the acceleration of the object. And the symbol v stands for the instantaneous velocity of the object; a subscript of i after the v (as in vi) indicates that the velocity value is the initial velocity value and a subscript of f (as in vf) indicates that the velocity value is the final velocity value. Problem-Solving Strategy In this part of Lesson 6 we will investigate the process of using the equations to determine unknown information about an object's motion. The process involves the use of a problem-solving strategy that will be used throughout the course. The strategy involves the following steps: 1. Construct an informative diagram of the physical situation. 2. Identify and list the given information in variable form. 3. Identify and list the unknown information in variable form. 4. Identify and list the equation that will be used to determine unknown information from known information. 5. Substitute known values into the equation and use appropriate algebraic steps to solve for the unknown information. 6. Check your answer to ensure that it is reasonable and mathematically correct. The use of this problem-solving strategy in the solution of the following problem is modeled in Examples A and B below. Example Problem A . Ima Hurryin is approaching a stoplight moving with a velocity of +30.0 m/s. The light turns yellow, and Ima applies the brakes and skids to a stop. If Ima's acceleration is -8.00 m/s2, then determine the displacement of the car during the skidding process. (Note that the direction of the velocity and the acceleration vectors are denoted by a + and a - sign.) The solution to this problem begins by the construction of an informative diagram of the physical situation. This is shown below. The second step involves the identification and listing of known information in variable form. Note that the vf value can be inferred to be 0 m/s since Ima's car comes to a stop. The initial velocity (vi) of the car is +30.0 m/s since this is the velocity at the beginning of the motion (the skidding motion). And the acceleration (a) of the car is given as - 8.00 m/s2. (Always pay careful attention to the + and - signs for the given quantities.) The next step of the strategy involves the listing of the unknown (or desired) information in variable form. In this case, the problem requests information about the displacement of the car. So d is the unknown quantity. The results of the first three steps are shown in the table below. Diagram: Given: Find: vi = +30.0 m/s vf = 0 m/s a = - 8.00 m/s2 d = ?? The next step of the strategy involves identifying a kinematic equation that would allow you to determine the unknown quantity. There are four kinematic equations to choose from. In general, you will always choose the equation that contains the three known and the one unknown variable. In this specific case, the three known variables and the one unknown variable are vf, vi, a, and d. Thus, you will look for an equation that has these four variables listed in it. An inspection of the four equations above reveals that the equation on the top right contains all four variables. vf2 = vi2 + 2 • a • d Once the equation is identified and written down, the next step of the strategy involves substituting known values into the equation and using proper algebraic steps to solve for the unknown information. This step is shown below. (0 m/s)2 = (30.0 m/s)2 + 2 • (-8.00 m/s2) • d 0 m2/s2 = 900 m2/s2 + (-16.0 m/s2) • d (16.0 m/s2) • d = 900 m2/s2 - 0 m2/s2 (16.0 m/s2)*d = 900 m2/s2 d = (900 m2/s2)/ (16.0 m/s2) d = (900 m2/s2)/ (16.0 m/s2) d = 56.3 m The solution above reveals that the car will skid a distance of 56.3 meters. (Note that this value is rounded to the third digit.) The last step of the problem-solving strategy involves checking the answer to assure that it is both reasonable and accurate. The value seems reasonable enough. It takes a car a considerable distance to skid from 30.0 m/s (approximately 65 mi/hr) to a stop. The calculated distance is approximately one-half a football field, making this a very reasonable skidding distance. Checking for accuracy involves substituting the calculated value back into the equation for displacement and insuring that the left side of the equation is equal to the right side of the equation. Indeed it is! Example Problem B Ben Rushin is waiting at a stoplight. When it finally turns green, Ben accelerated from rest at a rate of a 6.00 m/s2 for a time of 4.10 seconds. Determine the displacement of Ben's car during this time period. Once more, the solution to this problem begins by the construction of an informative diagram of the physical situation. This is shown below. The second step of the strategy involves the identification and listing of known information in variable form. Note that the vi value can be inferred to be 0 m/s since Ben's car is initially at rest. The acceleration (a) of the car is 6.00 m/s2. And the time (t) is given as 4.10 s. The next step of the strategy involves the listing of the unknown (or desired) information in variable form. In this case, the problem requests information about the displacement of the car. So d is the unknown information. The results of the first three steps are shown in the table below. Diagram: Given: Find: vi = 0 m/s t = 4.10 s a = 6.00 m/s2 d = ?? The next step of the strategy involves identifying a kinematic equation that would allow you to determine the unknown quantity. There are four kinematic equations to choose from. Again, you will always search for an equation that contains the three known variables and the one unknown variable. In this specific case, the three known variables and the one unknown variable are t, vi, a, and d. An inspection of the four equations above reveals that the equation on the top left contains all four variables. d = vi • t + ½ • a • t2 Once the equation is identified and written down, the next step of the strategy involves substituting known values into the equation and using proper algebraic steps to solve for the unknown information. This step is shown below. d = (0 m/s) • (4.1 s) + ½ • (6.00 m/s2) • (4.10 s)2 d = (0 m) + ½ • (6.00 m/s2) • (16.81 s2) d = 0 m + 50.43 m d = 50.4 m The solution above reveals that the car will travel a distance of 50.4 meters. (Note that this value is rounded to the third digit.) The last step of the problem-solving strategy involves checking the answer to assure that it is both reasonable and accurate. The value seems reasonable enough. A car with an acceleration of 6.00 m/s/s will reach a speed of approximately 24 m/s (approximately 50 mi/hr) in 4.10 s. The distance over which such a car would be displaced during this time period would be approximately one-half a football field, making this a very reasonable distance. Checking for accuracy involves substituting the calculated value back into the equation for displacement and insuring that the left side of the equation is equal to the right side of the equation. Indeed, it is! The two example problems above illustrate how the kinematic equations can be combined with a simple problem-solving strategy to predict unknown motion parameters for a moving object. Provided that three motion parameters are known, any of the remaining values can be determined. In the next part of Lesson 6, we will see how this strategy can be applied to free fall situations. Or if interested, you can try some practice problems and check your answer against the given solutions. Kinematic Equations and Free Fall As mentioned in Lesson 5, a free-falling object is an object that is falling under the sole influence of gravity. That is to say that any object that is moving and being acted upon only be the force of gravity is said to be "in a state of free fall." Such an object will experience a downward acceleration of 9.8 m/s/s. Whether the object is falling downward or rising upward towards its peak, if it is under the sole influence of gravity, then its acceleration value is 9.8 m/s/s. Like any moving object, the motion of an object in free fall can be described by four kinematic equations. The kinematic equations that describe any object's motion are: The symbols in the above equation have a specific meaning: the symbol d stands for the displacement; the symbol t stands for the time; the symbol a stands for the acceleration of the object; the symbol vi stands for the initial velocity value; and the symbol vf stands for the final velocity. Applying Free Fall Concepts to Problem-Solving There are a few conceptual characteristics of free fall motion that will be of value when using the equations to analyze free fall motion. These concepts are described as follows: • An object in free fall experiences an acceleration of -9.8 m/s/s. (The - sign indicates a downward acceleration.) Whether explicitly stated or not, the value of the acceleration in the kinematic equations is -9.8 m/s/s for any freely falling object. • If an object is merely dropped (as opposed to being thrown) from an elevated height, then the initial velocity of the object is 0 m/s. • If an object is projected upwards in a perfectly vertical direction, then it will slow down as it rises upward. The instant at which it reaches the peak of its trajectory, its velocity is 0 m/s. This value can be used as one of the motion parameters in the kinematic equations; for example, the final velocity (vf) after traveling to the peak would be assigned a value of 0 m/s. • If an object is projected upwards in a perfectly vertical direction, then the velocity at which it is projected is equal in magnitude and opposite in sign to the velocity that it has when it returns to the same height. That is, a ball projected vertically with an upward velocity of +30 m/s will have a downward velocity of -30 m/s when it returns to the same height. These four principles and the four kinematic equations can be combined to solve problems involving the motion of free-falling objects. The two examples below illustrate application of free fall principles to kinematic problem-solving. In each example, the problem solving strategy that was introduced earlier in this lesson will be utilized. Example Problem A Luke Autbeloe drops a pile of roof shingles from the top of a roof located 8.52 meters above the ground. Determine the time required for the shingles to reach the ground. The solution to this problem begins by the construction of an informative diagram of the physical situation. This is shown below. The second step involves the identification and listing of known information in variable form. You might note that in the statement of the problem, there is only one piece of numerical information explicitly stated: 8.52 meters. The displacement (d) of the shingles is -8.52 m. (The - sign indicates that the displacement is downward). The remaining information must be extracted from the problem statement based upon your understanding of the above principles. For example, the vi value can be inferred to be 0 m/s since the shingles are dropped (released from rest; see note above). And the acceleration (a) of the shingles can be inferred to be -9.8 m/s2 since the shingles are free-falling (see note above). (Always pay careful attention to the + and - signs for the given quantities.) The next step of the solution involves the listing of the unknown (or desired) information in variable form. In this case, the problem requests information about the time of fall. So t is the unknown quantity. The results of the first three steps are shown in the table below. Diagram: Given: Find: vi = 0.0 m/s d = -8.52 m a = - 9.8 m/s2 t = ?? The next step involves identifying a kinematic equation that allows you to determine the unknown quantity. There are four kinematic equations to choose from. In general, you will always choose the equation that contains the three known and the one unknown variable. In this specific case, the three known variables and the one unknown variable are d, vi, a, and t. Thus, you will look for an equation that has these four variables listed in it. An inspection of the four equations above reveals that the equation on the top left contains all four variables. d = vi • t + ½ • a • t2 Once the equation is identified and written down, the next step involves substituting known values into the equation and using proper algebraic steps to solve for the unknown information. This step is shown below. -8.52 m = (0 m/s) • (t) + ½ • (-9.8 m/s2) • (t)2 -8.52 m = (0 m) *(t) + (-4.9 m/s2) • (t)2 -8.52 m = (-4.9 m/s2) • (t)2 (-8.52 m)/(-4.9 m/s2) = t2 1.739 s2 = t2 t = 1.32 s The solution above reveals that the shingles will fall for a time of 1.32 seconds before hitting the ground. (Note that this value is rounded to the third digit.) The last step of the problem-solving strategy involves checking the answer to assure that it is both reasonable and accurate. The value seems reasonable enough. The shingles are falling a distance of approximately 10 yards (1 meter is pretty close to 1 yard); it seems that an answer between 1 and 2 seconds would be highly reasonable. The calculated time easily falls within this range of reasonability. Checking for accuracy involves substituting the calculated value back into the equation for time and insuring that the left side of the equation is equal to the right side of the equation. Indeed it is! Example Problem B Rex Things throws his mother's crystal vase vertically upwards with an initial velocity of 26.2 m/s. Determine the height to which the vase will rise above its initial height. Once more, the solution to this problem begins by the construction of an informative diagram of the physical situation. This is shown below. The second step involves the identification and listing of known information in variable form. You might note that in the statement of the problem, there is only one piece of numerical information explicitly stated: 26.2 m/s. The initial velocity (vi) of the vase is +26.2 m/s. (The + sign indicates that the initial velocity is an upwards velocity). The remaining information must be extracted from the problem statement based upon your understanding of the above principles. Note that the vf value can be inferred to be 0 m/s since the final state of the vase is the peak of its trajectory (see note above). The acceleration (a) of the vase is -9.8 m/s2 (see note above). The next step involves the listing of the unknown (or desired) information in variable form. In this case, the problem requests information about the displacement of the vase (the height to which it rises above its starting height). So d is the unknown information. The results of the first three steps are shown in the table below. Diagram: Given: Find: vi = 26.2 m/s vf = 0 m/s a = -9.8 m/s2 d = ?? The next step involves identifying a kinematic equation that would allow you to determine the unknown quantity. There are four kinematic equations to choose from. Again, you will always search for an equation that contains the three known variables and the one unknown variable. In this specific case, the three known variables and the one unknown variable are vi, vf, a, and d. An inspection of the four equations above reveals that the equation on the top right contains all four variables. vf2 = vi2 + 2 • a • d Once the equation is identified and written down, the next step involves substituting known values into the equation and using proper algebraic steps to solve for the unknown information. This step is shown below. (0 m/s)2 = (26.2 m/s)2 + 2 •(-9.8m/s2) •d 0 m2/s2 = 686.44 m2/s2 + (-19.6 m/s2) •d (-19.6 m/s2) • d = 0 m2/s2 -686.44 m2/s2 (-19.6 m/s2) • d = -686.44 m2/s2 d = (-686.44 m2/s2)/ (-19.6 m/s2) d = 35.0 m The solution above reveals that the vase will travel upwards for a displacement of 35.0 meters before reaching its peak. (Note that this value is rounded to the third digit.) The last step of the problem-solving strategy involves checking the answer to assure that it is both reasonable and accurate. The value seems reasonable enough. The vase is thrown with a speed of approximately 50 mi/hr (merely approximate 1 m/s to be equivalent to 2 mi/hr). Such a throw will never make it further than one football field in height (approximately 100 m), yet will surely make it past the 10-yard line (approximately 10 meters). The calculated answer certainly falls within this range of reasonability. Checking for accuracy involves substituting the calculated value back into the equation for displacement and insuring that the left side of the equation is equal to the right side of the equation. Indeed, it is! Kinematic equations provide a useful means of determining the value of an unknown motion parameter if three motion parameters are known. In the case of a free-fall motion, the acceleration is often known. And in many cases, another motion parameter can be inferred through a solid knowledge of some basic kinematic principles.Soil Erosion •Soil erosion is the washing away of soil by water and wind. •Water and wind are the main agents of soil erosion. •Animals and human activities also influence soil erosion. ✓Water: top soil is washed away ✓Wind: top soil is blown away ✓Animals: overgrazing, destruction of plants and roots ✓Humans: footpaths, deforestation, mining activities, land clearing for crop planting. Wind Water Human activity Deforestation Types of soil erosion •Splash erosion •Sheet erosion •Rill erosion •Gully erosion Splash erosion •Occurs when raindrops fall on loose bare soil •It is also called raindrop bomb Splash erosion Sheet erosion •Occurs when a thin layer of soil is washed away by the water or wind. •Mostly the topmost is washed away. Rill erosion •Occurs when small shallow channels develop. •It occurs when the water runs over the ground in little channels. •Little ridges or rills of soil are left behind. Rill erosion Gully erosion •Occurs when the channels become wide and deep. •Gullies are at least 30cm deep. •They occur mainly on steep slopes.Soils Southeast Asia, on balance, has a higher proportion of relatively fertile soils than most tropical regions, and soil erosion is less severe than elsewhere. Much of the region, however, is covered by tropical soils that generally are quite poor in nutrients. Often the profusion of plant life is more related to heat and moisture than to soil quality, even though these climatic conditions intensify both chemical weathering and the rate of bacterial action that usually improve soil fertility. Once the vegetation cover is removed, the supply of humus quickly disappears. In addition, the often heavy rainfall leaches the soils of their soluble nutrients, hastens erosion, and damages the soil texture. The leaching process in part results in laterites of reddish clay that contain hydroxides of iron and alumina. Laterite soils are common in parts of Myanmar, Thailand, and Vietnam and also occur in the islands of the Sunda Shelf, notably Borneo. The most fertile soils occur in regions of volcanic activity, where the ejecta is chemically alkaline or neutral. Such soils are found in parts of Sumatra and much of Java in Indonesia. The alluvial soils of the river valleys also are highly fertile and are intensively cultivated. Climate All of Southeast Asia falls within the warm, humid tropics, and its climate generally can be characterized as monsoonal (i.e., marked by wet and dry periods). Changing seasons are more associated with rainfall than with temperature variations. There is, however, a high degree of climatic complexity within the region. Temperatures Regional temperatures at or near sea level remain fairly constant throughout the year, although monthly averages tend to vary more with increasing latitude. Thus, with the exception of northern Vietnam, annual average temperatures are close to 80 °F (27 °C). Increasing elevation acts to decrease average temperatures, and such locations as the Cameron Highlands in peninsular Malaysia and Baguio in the Philippines have become popular tourist destinations in part because of their relatively cooler climates. Proximity to the sea also tends to moderate temperatures. Precipitation Much of Southeast Asia receives more than 60 inches (1,500 millimeters) of rainfall annually, and many areas commonly receive double and even triple that amount. The rainfall pattern is distinctly affected by two prevailing air currents: the northeast (or dry) monsoon and the southwest (or wet) monsoon. The northeast monsoon occurs roughly from November to March and brings relatively dry, cool air and little precipitation to the mainland. As the southwestward-flowing air passes over the warmer sea, it gradually warms and gathers moisture. Precipitation is especially heavy where the airstream is forced to rise over mountains or encounters a landmass. The east coast of peninsular Malaysia, the Philippines, and parts of eastern Indonesia receive the heaviest rains during this period. The southwest monsoon prevails from May to September, when the air current reverses and the dominant flow is to the northeast. The mainland receives the bulk of its rainfall during this period. Over much of the southern Malay Peninsula and insular Southeast Asia there is little or no prolonged dry season. This is especially marked in much of the equatorial region and along the east coast of the Philippines. While the dry and wet monsoons are important in explaining rainfall patterns, so too are such factors as relief, land and sea breezes, convectional overturning and cyclonic disturbances. These factors often are combined with monsoonal effects to produce highly variable rainfall patterns over relatively short distances. While many of the cyclonic disturbances produce only moderate rainfall, others mature into tropical storms—called cyclones in the Indian Ocean and typhoons in the Pacific—that bring heavy rains and destruction to the areas over which they pass. The Philippines are particularly affected by these storms. Plant life Tropical forests in Southeast Asia Tropical forests in Southeast Asia The seasonal nature and pattern of Southeast Asia’s rainfall, as well as the region’s physiography, have strongly affected the development of natural vegetation. The hot, humid climate and enormous variety of habitats have given rise to an abundance and diversity of vegetative forms unlike that in any other area of the world. Much of the natural vegetation has been modified by human action, although large areas of relatively untouched land still can be found. The vegetation can be grouped into two broad categories: the tropical-evergreen forests of the equatorial lowlands and the open type of tropical-deciduous, or “monsoon,” forests in areas of seasonal drought. The evergreen forests are characterized by multiple stories of vegetation, consisting of a variety of trees and plants. Although a large diversity of tree species is found in these forests, members of the Dipterocarpaceae family account for roughly half of the varieties. Deciduous forests are found in eastern Indonesia and those parts of the mainland where annual rainfall does not exceed 80 inches. Just as in the equatorial forest, a wide variety of species is normally the rule. Certain species, such as teak, have become highly valued commercially. Teak is found in parts of Indonesia, Myanmar, Thailand, and Laos. In addition to these two basic types of vegetation, other regional patterns reflect topography. Especially noteworthy are coastal and highland plant communities. Mangrove belts, of which there are more than 30 varieties, occur where silt is deposited in coastal areas. Upland forests dominated by maples, oaks, and magnolias are found especially on mainland mountain slopes. Human activity has been rapidly altering the stands of virgin forest in Southeast Asia. Most deforestation results from removal for fuelwood and clearing for agriculture and grazing. Although only a relatively small portion of the total land area has been permanently cleared for cultivation—e.g., in Java (Indonesia) and western Luzon (the Philippines)—in some areas shifting cultivation has brought about the replacement of virgin forest with secondary growth. In addition, nearly all countries have commercial logging industries; notable are those in Indonesia, Malaysia, Thailand, and Myanmar. A growing problem has been illegal logging. Thus, timber harvesting has come to contribute significantly to deforestation. Programs in social forestry and reforestation have yet to halt the rapid denuding of the landscape. Animal life Southeast Asia is situated where two major divisions of the world’s fauna meet. The region itself constitutes the eastern half of what is called the Oriental, or Indian, zoogeographic region (part of the much larger realm of Megagaea). Bordering along the south and east is the Australian zoogeographic region, and the eastern portion of insular Southeast Asia—Celebes (Sulawesi), the Moluccas, and the Lesser Sunda Islands—constitutes a transition zone between these two faunal regions. a classroom in Brazil More From Britannica education: Southeast Asia Southeast Asia is notable, therefore, for a considerable diversity of wildlife throughout the region. These differences are especially striking between the species of the eastern and western fringes as well as between those of the archipelagic south and the mainland north. The differences stem largely from the isolation, over varying lengths of geologic time, of species following their migration from the Asian continent. In addition, the tropical rain forests in many parts of the region, with their great diversity of vegetation, have made possible the development of complex communities of animals that fill specialized ecological niches. Especially numerous are arboreal and flying creatures. orangutans orangutansOrangutans (Pongo pygmaeus) in Sumatra, Indonesia. The distinction between the two faunal regions is best depicted by their mammal populations. In general, Australia is inhabited largely by marsupials (pouched mammals) and monotremes (egg-laying mammals), while Southeast Asia contains placental mammals and such hybrid species as the bandicoot of eastern Indonesia. Small mammals such as monkeys and shrews are the most numerous, while in many areas the larger mammals have been pushed into more remote areas and national preserves. Bears, gibbons, elephants, deer, civets, and pigs are found in both mainland and insular Southeast Asia, as are diminishing numbers of tigers. The Malayan tapir, a relative of the rhinoceros, is native to the Malay Peninsula and Sumatra, while the tarsier is found in the Philippines and parts of Indonesia. A number of rare endemic species are found in Indonesia and East (insular) Malaysia, including the Sumatran and Javan rhinoceros, the orangutan, the anoa (a dwarf buffalo), the babirusa (a wild swine), and the palm civet. As the pace of development accelerates and populations continue to expand in Southeast Asia, concern has increased regarding the impact of human activity on the region’s environment. A significant portion of Southeast Asia, however, has not changed greatly and remains an unaltered home to wildlife. The nations of the region, with only few exceptions, have become aware of the need to maintain forest cover not only to prevent soil erosion but to preserve the diversity of flora and fauna. Indonesia, for example, has created an extensive system of national parks and preserves for this purpose. Even so, such species as the Javan rhinoceros face extinction, with only a handful of the animals remaining in western JavaWeathering describes the breaking down or dissolving of rocks and minerals on the surface of the Earth. Water, ice, acids, salts, plants, animals, and changes in temperature are all agents of weathering. Once a rock has been broken down, a process called erosion transports the bits of rock and mineral away. No rock on Earth is hard enough to resist the forces of weathering and erosion. Together, these processes carved landmarks such as the Grand Canyon, in the U.S. state of Arizona. This massive canyon is 446 kilometers (277 miles) long, as much as 29 kilometers (18 miles) wide, and 1,600 meters (1 mile) deep. Weathering and erosion constantly change the rocky landscape of Earth. Weathering wears away exposed surfaces over time. The length of exposure often contributes to how vulnerable a rock is to weathering. Rocks, such as lavas, that are quickly buried beneath other rocks are less vulnerable to weathering and erosion than rocks that are exposed to agents such as wind and water, As it smoothes rough, sharp rock surfaces, weathering is often the first step in the production of soils. Tiny bits of weathered minerals mix with plants, animal remains, fungi, bacteria, and other organisms. A single type of weathered rock often produces infertile soil, while weathered materials from a collection of rocks is richer in mineral diversity and contributes to more fertile soil. Soils types associated with a mixture of weathered rock include glacial till, loess, and alluvial sediments. Weathering is often divided into the processes of mechanical weathering and chemical weathering. Biological weathering, in whichliving or once-living organisms contribute to weathering, can be a part of both processes. Mechanical Weathering Mechanical weathering, also called physical weathering and disaggregation, causes rocks to crumble. Water, in either liquid or solid form, is often a key agent of mechanical weathering. For instance, liquid water can seep into cracks and crevices in rock. If temperatures drop low enough, the water will freeze. When water freezes, it expands. The ice then works as a wedge. It slowly widens the cracks and splits the rock. When ice melts, liquid water performs the act of erosion by carrying away the tiny rock fragments lost in the split. This specific process (the freeze-thaw cycle) is called frost weathering or cryofracturing. Figure 4.3 Frost Wedging Temperature changes can also contribute to mechanical weathering in a process called thermal stress. Changes in temperature cause rock to expand (with heat) and contract (with cold). As this happens over and over again. the structure of the rock weakens. Over time, it crumbles. Rocky desert landscapes are particularly vulnerable to thermal stress. The outer layer of desert rocks undergo repeated stress as the temperature changes from day Eventually, Lo outer night. layersflake off in thin sheets, a process called exfoliation. Exfoliation contributes to the formation of bornhardts, one of the most dramatic features in landscapes formed by weathering and erosion. Bornhardts are tall, domed, isolated rocks often found areas. in tropical Sugarloaf Mountain, an iconic landmark in Rio de Janeiro, Brazil, is bornhardt. a Salt also works to weather rock in a process called haloclasty. Saltwater sometimes gets into the cracks and pores of rock. If the saltwater evaporates, salt crystals are left behind. As the crystals grow, they put pressure on the rock, slowly breaking it apart. Plants and animals can be agents of mechanical weathering. The seed of a tree may sprout in soil that has collected in a cracked rock. As the roots grow, they widen the cracks, eventually breaking the rock into pieces. Over time, trees can break apart even large rocks. Even small plants, such as mosses, can enlarge tiny cracks as they grow. Animals that tunnel underground, such as moles and prairie dogs, also work to break apart rock and soil. Other animals dig and trample rock aboveground, causing rock to slowly crumble. Chemical Weathering Chemical weathering changes the molecular structure of rocks and soil.For instance, carbon dioxide from the air or soil sometimes combines with water in a process called carbonation. This produces a weak acid, called carbonic acid, that can dissolve rock. Carbonic acid is especially effective at dissolving limestone. When carbonic acid seeps through limestone underground, it can open up huge cracks or hollow out vast networks of caves. Carlsbad Caverns National Park, in the U.S. state of New Mexico, includes more than 119 limestone caves created by weathering and erosion. The largest is called the Big Room.. With an area of about 33,210 square meters (357,469 square feet), the Big Room is the size of six football fields. Another type of chemical weathering works on rocks that contain iron. These rocks turn to rust in a process called oxidation. Rust is a compound created by the interaction of oxygen and iron in the presence of water. As rust expands, it weakens rock and helps break it apart. Another familiar form of chemical weathering is hydrolysis. In the process of hydrolysis, a new solution (a mixture of two or more substances) is formed as chemicals in rock interact with water. In many rocks, for example, sodium minerals interact with water to form a saltwater solution. Hydration and hydrolysis contribute to flared slopes, another dramatic example of a landscape formed by weathering and erosion. Flared slopes are sometimes nicknamed "wave rocks." Their c-shape is largely concave rock formations a result of subsurface weathering, in which hydration and hydrolysis wear away rocks beneath the landscape's surfaceWeathering and People Weathering is a natural process, but human activities can speed it up. For example, certain kinds of air pollution increase the rate of weathering Burning coal, natural and petroleum releases chemicals such as nitrogen oxide and gas, sulfur dioxide into the atmosphere. When these chemicals combine with sunlight and moisture, they change into acids. They then fall back to Earth as acid rain. Acid rain rapidly weathers limestone, marble, and other kinds of stone. The effects of acid rain can often be seen on gravestones, making names and other inscriptions impossible to read. Acid rain has also damaged many historic buildings and monuments. For example, at 71 meters (233 feet) tall, the Leshan Giant Buddha at Mount Emei, China is the world's largest statue of the Buddha. It was carved 1,300 years ago and sat unharmed for centuries. An innovative drainage system mitigates the natural process of erosion But in recent years, acid rain has turned the statue's nose black and made some of its hair crumble and fall.3. Volcanoes are often found at meeting points of “tectonic plates”. These plates are pieces of the Earth’s surface that fit together just like a jigsaw puzzle. 4. Volcanoes can also occur over “mantle plumes”. Ever heard of mantle plumes? They’re super-hot areas of rock inside the Earth! Did you know that we have a FREE downloadable Volcanoes of Ecuador primary resource? Great for teachers, homeschoolers and parents alike! 5. Approximately 350 million people live within “danger range” of an active volcano. That means that around one in 20 people live in an area at risk of volcanic activity. Volcano facts 6. Volcanoes are classified as active, dormant or extinct. This refers to the amount of volcanic activity. “Active” means there’s regular activity, “dormant” means there’s been recent activity but the volcano is currently quiet, and “extinct” means it’s been so long since the last eruption that it’s unlikely to ever erupt again. 7. Volcanoes can be a variety of shapes. These geographical wonders come in various shapes and sizes, but there are two main types – composite volcanoes, which are cone-shaped with steep slopes, and shield volcanoes, which are wide with gentle slopes. 8. Magma and lava are two different things! Magma is the name given to hot liquid rock inside a volcano. Once it leaves the volcano, it’s known as lava. Psst! Make sure you download our awesome volcano facts infographic – show your friends, family, or stick it on your wall!