Loading...
Unit 3 - Weather
Quiz by Rizzotti, Christopher
Customize this quiz to suit your class
Instantly translate to 100+ languages
Tag the questions with any skills you have. Your dashboard will track each student's mastery of each skill.
Give this quiz to my class
What is the main source of energy that drives all weather patterns?
wind
the sun
the moon
water
Directions: The weather map below shows the movement of the polar jet stream on a day in January. The polar jet stream is a strong wind current that travels through Canada and the United States. Use the map to answer the questions that follow.
Using the map, which statement best describes the temperatures of Portland, Oregon, and Eugene, Oregon, on this day in January?
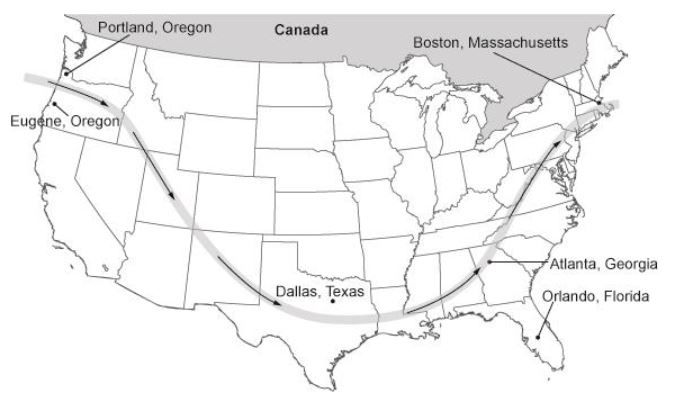
Eugene was the same temperature as Portland, because the cities are very close together.
Portland was a little colder than Eugene, because it is a little farther north.
Eugene was much colder than Portland, because Eugene is south of the polar jet stream.
Portland was much colder than Eugene, because Portland is north of the polar jet stream.
What is the main source of energy that drives all weather patterns?
Directions: The weather map below shows the movement of the polar jet stream on a day in January. The polar jet stream is a strong wind current that travels through Canada and the United States. Use the map to answer the questions that follow.
Using the map, which statement best describes the temperatures of Portland, Oregon, and Eugene, Oregon, on this day in January?

Which of the following processes describes warm atmospheric air rising and transferring energy to cooler atmospheric air that is sinking?
Which of the following is NOT a long-term impact that hurricanes have had on the people of Florida?
Which information could be used to determine the climate of a region?
A group of students conduct a survey to find the average amount of physical activity completed by their classmates each day. What is an example of quantitative data the students can collect?
Global ocean currents affect weather conditions around the world. What produces surface ocean currents?
Which statement correctly describes a convection current?
Hurricanes or typhoons form over ocean waters near the equator.
Why might a hurricane follow the path formed by the Gulf Stream current?
The picture below shows some of the world's ocean currents.
Based on the picture, what can be said about the weather in San Francisco, California, and Washington, D.C.?

Which part of the water cycle is influenced most directly by the Sun's energy?
Which statement best describes how air circulation patterns in the atmosphere are created?
Which statement is a description of climate?
Which type of data describes weather?
The graph below shows the average temperatures and precipitation for Edinburgh, Scotland, from 1925 to 1975.
Which statement best describes the graph?

The table shows compiled data for Clermont, Florida, over a 29 year period. TEMPERATURE DATA FOR CLERMONT, FLORIDA, 1961-1990
Which information does this table provide?

Directions: The table below shows several natural disasters in Florida, when they occurred, the number of deaths they caused, and the cost of the damage. Use the table to answer any questions that follow.
Based on the table, which type of natural disaster had the greatest impact on people in Florida?

Which of these events can cause water currents and waves that wash away sand and damage Florida beaches?
Which of the following statements correctly describes part of the overall impact that hurricanes and tropical storms have on Florida’s economy?
Look at the picture of the hurricane shown.
The center of a hurricane, where there are no clouds, is called its “eye.” When the eye of a hurricane passes overhead, the hurricane’s stormy weather stops, the winds become calm, and it is often sunny for a period of time. Which of these statements is true?

The picture shows windows being boarded up on a home before a hurricane.
Which statement best explains the purpose of the boards during a hurricane?

Five groups of students are completing an investigation in science class. Each group places a cup of 100 mL of water in sunlight. They check the temperature of their cup every 10 minutes for one hour. They record their results in a chart, but want to see how the temperature changed over time. One of the groups had temperatures that were much higher than the other groups. Should their results still be included in the graph of results for the class?
When the results of an experiment do NOT support the hypothesis, how can the use of creativity most likely help scientists?
Which activity usually requires the most creativity?
Air currents are caused by differences in temperature, which are created by
What do we call the calm area located in the centre of the hurricane?
Which of the following is a good definition of climate?
Which of the following phenomena is not considered to be a consequence of climate change?
Which of the following climatic zones has wet and hot weather conditions all year round?
The increasing concentration of which gas is a main cause of global warming?