
Variables and basic data types in Python
Quiz by Phuong Do Thi
Customize this quiz to suit your class
Instantly translate to 100+ languages
Tag the questions with any skills you have. Your dashboard will track each student's mastery of each skill.
Give this quiz to my class
Cho x = 'Hello', y = 'World'.
'Hello World' là kết quả của câu lệnh nào dưới đây?
Cho x = 'Hello', y = 'World'.
'Hello World' là kết quả của câu lệnh nào dưới đây?

Index mặc định của chuỗi trong Python bắt đầu từ đâu?
Hãy nối kiểu dữ liệu tương ứng
Đâu là tên biến hợp lệ trong Python?
Trong Python, kiểu dữ liệu boolean có thể nhận bao nhiêu giá trị?
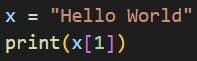
Đoạn lệnh sau in ra kết quả gì?

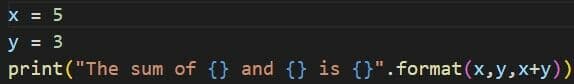
Kết quả của đoạn code sau là?

Cách để comment trên 1 dòng trong Python?
Kết quả của câu lệnh sau là gì?

Nối các biến với kiểu dữ liệu tương ứng.
Cho x =25.23546. Lệnh print('{:.2f}'.format(x)) sẽ in ra màn hình kết quả nào sau đây?
Introduction to Free Fall A free-falling object is an object that is falling under the sole influence of gravity. Any object that is being acted upon only by the force of gravity is said to be in a state of free fall. There are two important motion characteristics that are true of free-falling objects: • Free-falling objects do not encounter air resistance. • All free-falling objects (on Earth) accelerate downwards at a rate of 9.8 m/s/s (often approximated as 10 m/s/s for back-of-the-envelope calculations) Because free-falling objects are accelerating downwards at a rate of 9.8 m/s/s, a ticker tape trace or dot diagram of its motion would depict an acceleration. The dot diagram at the right depicts the acceleration of a free-falling object. The position of the object at regular time intervals - say, every 0.1 second - is shown. The fact that the distance that the object travels every interval of time is increasing is a sure sign that the ball is speeding up as it falls downward. Recall from an earlier lesson, that if an object travels downward and speeds up, then its acceleration is downward. Free-fall acceleration is often witnessed in a physics classroom by means of an ever-popular strobe light demonstration. The room is darkened and a jug full of water is connected by a tube to a medicine dropper. The dropper drips water and the strobe illuminate the falling droplets at a regular rate - say once every 0.2 seconds. Instead of seeing a stream of water free-falling from the medicine dropper, several consecutive drops with increasing separation distance are seen. The pattern of drops resembles the dot diagram shown in the graphic at the right. The Acceleration of Gravity It was learned in the previous part of this lesson that a free-falling object is an object that is falling under the sole influence of gravity. A free-falling object has an acceleration of 9.8 m/s/s, downward (on Earth). This numerical value for the acceleration of a free-falling object is such an important value that it is given a special name. It is known as the acceleration of gravity - the acceleration for any object moving under the sole influence of gravity. A matter of fact, this quantity known as the acceleration of gravity is such an important quantity that physicists have a special symbol to denote it - the symbol g. The numerical value for the acceleration of gravity is most accurately known as 9.8 m/s2. There are slight variations in this numerical value (to the second decimal place) that are dependent primarily upon on altitude. We will occasionally use the approximated value of 10 m/s2 in order to reduce the complexity of the many mathematical tasks that we will perform with this number. By so doing, we will be able to better focus on the conceptual nature of physics without too much of a sacrifice in numerical accuracy. g = 9.8 m/s2, downward Look It Up! Even on the surface of the Earth, there are local variations in the value of the acceleration of gravity (g). These variations are due to latitude, altitude and the local geological structure of the region. Recall from an earlier lesson that acceleration is the rate at which an object changes its velocity. It is the ratio of velocity change to time between any two points in an object's path. To accelerate at 9.8 m/s2 means to change the velocity by 9.8 m/s each second. If the velocity and time for a free-falling object being dropped from a position of rest were tabulated, then one would note the following pattern. Time (s) Velocity (m/s) 0 0 1 - 9.8 2 - 19.6 3 - 29.4 4 - 39.2 5 - 49.0 . Observe that the velocity-time data above reveal that the object's velocity is changing by 9.8 m/s each consecutive second. That is, the free-falling object has an acceleration of approximately 9.8 m/s2. Another way to represent this acceleration of 9.8 m/s2 is to add numbers to our dot diagram that we saw earlier in this lesson. The velocity of the ball is seen to increase as depicted in the diagram at the right. (NOTE: The diagram is not drawn to scale - in two seconds, the object would drop considerably further than the distance from shoulder to toes.) Representing Free Fall by Graphs • Early in Lesson 1 it was mentioned that there are a variety of means of describing the motion of objects. One such means of describing the motion of objects is through the use of graphs - position versus time and velocity vs. time graphs. In this part of Lesson 5, the motion of a free-falling motion will be represented using these two basic types of graphs. Representing Free Fall by Position-Time Graphs A position versus time graph for a free-falling object is shown below. Observe that the line on the graph curves. As learned earlier, a curved line on a position versus time graph signifies an accelerated motion. Since a free-falling object is undergoing an acceleration (g = 9.8 m/s/s), it would be expected that its position-time graph would be curved. A further look at the position-time graph reveals that the object starts with a small velocity (slow) and finishes with a large velocity (fast). Since the slope of any position vs. time graph is the velocity of the object (as learned in Lesson 3), the small initial slope indicates a small initial velocity and the large final slope indicates a large final velocity. Finally, the negative slope of the line indicates a negative (i.e., downward) velocity. Representing Free Fall by Velocity-Time Graphs A velocity versus time graph for a free-falling object is shown below. Observe that the line on the graph is a straight, diagonal line. As learned earlier, a diagonal line on a velocity versus time graph signifies an accelerated motion. Since a free-falling object is undergoing an acceleration (g = 9,8 m/s/s, downward), it would be expected that its velocity-time graph would be diagonal. A further look at the velocity-time graph reveals that the object starts with a zero velocity (as read from the graph) and finishes with a large, negative velocity; that is, the object is moving in the negative direction and speeding up. An object that is moving in the negative direction and speeding up is said to have a negative acceleration (if necessary, review the vector nature of acceleration). Since the slope of any velocity versus time graph is the acceleration of the object (as learned in Lesson 4), the constant, negative slope indicates a constant, negative acceleration. This analysis of the slope on the graph is consistent with the motion of a free-falling object - an object moving with a constant acceleration of 9.8 m/s/s in the downward direction. The Kinematic Equations The goal of this first unit has been to investigate the variety of means by which the motion of objects can be described. The variety of representations that we have investigated includes verbal representations, pictorial representations, numerical representations, and graphical representations (position-time graphs and velocity-time graphs). In Lesson 6, we will investigate the use of equations to describe and represent the motion of objects. These equations are known as kinematic equations. There are a variety of quantities associated with the motion of objects - displacement (and distance), velocity (and speed), acceleration, and time. Knowledge of each of these quantities provides descriptive information about an object's motion. For example, if a car is known to move with a constant velocity of 22.0 m/s, North for 12.0 seconds for a northward displacement of 264 meters, then the motion of the car is fully described. And if a second car is known to accelerate from a rest position with an eastward acceleration of 3.0 m/s2 for a time of 8.0 seconds, providing a final velocity of 24 m/s, East and an eastward displacement of 96 meters, then the motion of this car is fully described. These two statements provide a complete description of the motion of an object. However, such completeness is not always known. It is often the case that only a few parameters of an object's motion are known, while the rest are unknown. For example as you approach the stoplight, you might know that your car has a velocity of 22 m/s, East and is capable of a skidding acceleration of 8.0 m/s2, West. However you do not know the displacement that your car would experience if you were to slam on your brakes and skid to a stop; and you do not know the time required to skid to a stop. In such an instance as this, the unknown parameters can be determined using physics principles and mathematical equations (the kinematic equations). The BIG 4 The kinematic equations are a set of four equations that can be utilized to predict unknown information about an object's motion if other information is known. The equations can be utilized for any motion that can be described as being either a constant velocity motion (an acceleration of 0 m/s/s) or a constant acceleration motion. They can never be used over any time period during which the acceleration is changing. Each of the kinematic equations include four variables. If the values of three of the four variables are known, then the value of the fourth variable can be calculated. In this manner, the kinematic equations provide a useful means of predicting information about an object's motion if other information is known. For example, if the acceleration value and the initial and final velocity values of a skidding car is known, then the displacement of the car and the time can be predicted using the kinematic equations. Lesson 6 of this unit will focus upon the use of the kinematic equations to predict the numerical values of unknown quantities for an object's motion. The four kinematic equations that describe an object's motion are: There are a variety of symbols used in the above equations. Each symbol has its own specific meaning. The symbol d stands for the displacement of the object. The symbol t stands for the time for which the object moved. The symbol a stands for the acceleration of the object. And the symbol v stands for the velocity of the object; a subscript of i after the v (as in vi) indicates that the velocity value is the initial velocity value and a subscript of f (as in vf) indicates that the velocity value is the final velocity value. Each of these four equations appropriately describes the mathematical relationship between the parameters of an object's motion. As such, they can be used to predict unknown information about an object's motion if other information is known. In the next part of Lesson 6 we will investigate the process of doing this. Kinematic Equations and Problem-Solving The four kinematic equations that describe the mathematical relationship between the parameters that describe an object's motion were introduced in the previous part of Lesson 6. The four kinematic equations are: In the above equations, the symbol d stands for the displacement of the object. The symbol t stands for the time for which the object moved. The symbol a stand for the acceleration of the object. And the symbol v stands for the instantaneous velocity of the object; a subscript of i after the v (as in vi) indicates that the velocity value is the initial velocity value and a subscript of f (as in vf) indicates that the velocity value is the final velocity value. Problem-Solving Strategy In this part of Lesson 6 we will investigate the process of using the equations to determine unknown information about an object's motion. The process involves the use of a problem-solving strategy that will be used throughout the course. The strategy involves the following steps: 1. Construct an informative diagram of the physical situation. 2. Identify and list the given information in variable form. 3. Identify and list the unknown information in variable form. 4. Identify and list the equation that will be used to determine unknown information from known information. 5. Substitute known values into the equation and use appropriate algebraic steps to solve for the unknown information. 6. Check your answer to ensure that it is reasonable and mathematically correct. The use of this problem-solving strategy in the solution of the following problem is modeled in Examples A and B below. Example Problem A . Ima Hurryin is approaching a stoplight moving with a velocity of +30.0 m/s. The light turns yellow, and Ima applies the brakes and skids to a stop. If Ima's acceleration is -8.00 m/s2, then determine the displacement of the car during the skidding process. (Note that the direction of the velocity and the acceleration vectors are denoted by a + and a - sign.) The solution to this problem begins by the construction of an informative diagram of the physical situation. This is shown below. The second step involves the identification and listing of known information in variable form. Note that the vf value can be inferred to be 0 m/s since Ima's car comes to a stop. The initial velocity (vi) of the car is +30.0 m/s since this is the velocity at the beginning of the motion (the skidding motion). And the acceleration (a) of the car is given as - 8.00 m/s2. (Always pay careful attention to the + and - signs for the given quantities.) The next step of the strategy involves the listing of the unknown (or desired) information in variable form. In this case, the problem requests information about the displacement of the car. So d is the unknown quantity. The results of the first three steps are shown in the table below. Diagram: Given: Find: vi = +30.0 m/s vf = 0 m/s a = - 8.00 m/s2 d = ?? The next step of the strategy involves identifying a kinematic equation that would allow you to determine the unknown quantity. There are four kinematic equations to choose from. In general, you will always choose the equation that contains the three known and the one unknown variable. In this specific case, the three known variables and the one unknown variable are vf, vi, a, and d. Thus, you will look for an equation that has these four variables listed in it. An inspection of the four equations above reveals that the equation on the top right contains all four variables. vf2 = vi2 + 2 • a • d Once the equation is identified and written down, the next step of the strategy involves substituting known values into the equation and using proper algebraic steps to solve for the unknown information. This step is shown below. (0 m/s)2 = (30.0 m/s)2 + 2 • (-8.00 m/s2) • d 0 m2/s2 = 900 m2/s2 + (-16.0 m/s2) • d (16.0 m/s2) • d = 900 m2/s2 - 0 m2/s2 (16.0 m/s2)*d = 900 m2/s2 d = (900 m2/s2)/ (16.0 m/s2) d = (900 m2/s2)/ (16.0 m/s2) d = 56.3 m The solution above reveals that the car will skid a distance of 56.3 meters. (Note that this value is rounded to the third digit.) The last step of the problem-solving strategy involves checking the answer to assure that it is both reasonable and accurate. The value seems reasonable enough. It takes a car a considerable distance to skid from 30.0 m/s (approximately 65 mi/hr) to a stop. The calculated distance is approximately one-half a football field, making this a very reasonable skidding distance. Checking for accuracy involves substituting the calculated value back into the equation for displacement and insuring that the left side of the equation is equal to the right side of the equation. Indeed it is! Example Problem B Ben Rushin is waiting at a stoplight. When it finally turns green, Ben accelerated from rest at a rate of a 6.00 m/s2 for a time of 4.10 seconds. Determine the displacement of Ben's car during this time period. Once more, the solution to this problem begins by the construction of an informative diagram of the physical situation. This is shown below. The second step of the strategy involves the identification and listing of known information in variable form. Note that the vi value can be inferred to be 0 m/s since Ben's car is initially at rest. The acceleration (a) of the car is 6.00 m/s2. And the time (t) is given as 4.10 s. The next step of the strategy involves the listing of the unknown (or desired) information in variable form. In this case, the problem requests information about the displacement of the car. So d is the unknown information. The results of the first three steps are shown in the table below. Diagram: Given: Find: vi = 0 m/s t = 4.10 s a = 6.00 m/s2 d = ?? The next step of the strategy involves identifying a kinematic equation that would allow you to determine the unknown quantity. There are four kinematic equations to choose from. Again, you will always search for an equation that contains the three known variables and the one unknown variable. In this specific case, the three known variables and the one unknown variable are t, vi, a, and d. An inspection of the four equations above reveals that the equation on the top left contains all four variables. d = vi • t + ½ • a • t2 Once the equation is identified and written down, the next step of the strategy involves substituting known values into the equation and using proper algebraic steps to solve for the unknown information. This step is shown below. d = (0 m/s) • (4.1 s) + ½ • (6.00 m/s2) • (4.10 s)2 d = (0 m) + ½ • (6.00 m/s2) • (16.81 s2) d = 0 m + 50.43 m d = 50.4 m The solution above reveals that the car will travel a distance of 50.4 meters. (Note that this value is rounded to the third digit.) The last step of the problem-solving strategy involves checking the answer to assure that it is both reasonable and accurate. The value seems reasonable enough. A car with an acceleration of 6.00 m/s/s will reach a speed of approximately 24 m/s (approximately 50 mi/hr) in 4.10 s. The distance over which such a car would be displaced during this time period would be approximately one-half a football field, making this a very reasonable distance. Checking for accuracy involves substituting the calculated value back into the equation for displacement and insuring that the left side of the equation is equal to the right side of the equation. Indeed, it is! The two example problems above illustrate how the kinematic equations can be combined with a simple problem-solving strategy to predict unknown motion parameters for a moving object. Provided that three motion parameters are known, any of the remaining values can be determined. In the next part of Lesson 6, we will see how this strategy can be applied to free fall situations. Or if interested, you can try some practice problems and check your answer against the given solutions. Kinematic Equations and Free Fall As mentioned in Lesson 5, a free-falling object is an object that is falling under the sole influence of gravity. That is to say that any object that is moving and being acted upon only be the force of gravity is said to be "in a state of free fall." Such an object will experience a downward acceleration of 9.8 m/s/s. Whether the object is falling downward or rising upward towards its peak, if it is under the sole influence of gravity, then its acceleration value is 9.8 m/s/s. Like any moving object, the motion of an object in free fall can be described by four kinematic equations. The kinematic equations that describe any object's motion are: The symbols in the above equation have a specific meaning: the symbol d stands for the displacement; the symbol t stands for the time; the symbol a stands for the acceleration of the object; the symbol vi stands for the initial velocity value; and the symbol vf stands for the final velocity. Applying Free Fall Concepts to Problem-Solving There are a few conceptual characteristics of free fall motion that will be of value when using the equations to analyze free fall motion. These concepts are described as follows: • An object in free fall experiences an acceleration of -9.8 m/s/s. (The - sign indicates a downward acceleration.) Whether explicitly stated or not, the value of the acceleration in the kinematic equations is -9.8 m/s/s for any freely falling object. • If an object is merely dropped (as opposed to being thrown) from an elevated height, then the initial velocity of the object is 0 m/s. • If an object is projected upwards in a perfectly vertical direction, then it will slow down as it rises upward. The instant at which it reaches the peak of its trajectory, its velocity is 0 m/s. This value can be used as one of the motion parameters in the kinematic equations; for example, the final velocity (vf) after traveling to the peak would be assigned a value of 0 m/s. • If an object is projected upwards in a perfectly vertical direction, then the velocity at which it is projected is equal in magnitude and opposite in sign to the velocity that it has when it returns to the same height. That is, a ball projected vertically with an upward velocity of +30 m/s will have a downward velocity of -30 m/s when it returns to the same height. These four principles and the four kinematic equations can be combined to solve problems involving the motion of free-falling objects. The two examples below illustrate application of free fall principles to kinematic problem-solving. In each example, the problem solving strategy that was introduced earlier in this lesson will be utilized. Example Problem A Luke Autbeloe drops a pile of roof shingles from the top of a roof located 8.52 meters above the ground. Determine the time required for the shingles to reach the ground. The solution to this problem begins by the construction of an informative diagram of the physical situation. This is shown below. The second step involves the identification and listing of known information in variable form. You might note that in the statement of the problem, there is only one piece of numerical information explicitly stated: 8.52 meters. The displacement (d) of the shingles is -8.52 m. (The - sign indicates that the displacement is downward). The remaining information must be extracted from the problem statement based upon your understanding of the above principles. For example, the vi value can be inferred to be 0 m/s since the shingles are dropped (released from rest; see note above). And the acceleration (a) of the shingles can be inferred to be -9.8 m/s2 since the shingles are free-falling (see note above). (Always pay careful attention to the + and - signs for the given quantities.) The next step of the solution involves the listing of the unknown (or desired) information in variable form. In this case, the problem requests information about the time of fall. So t is the unknown quantity. The results of the first three steps are shown in the table below. Diagram: Given: Find: vi = 0.0 m/s d = -8.52 m a = - 9.8 m/s2 t = ?? The next step involves identifying a kinematic equation that allows you to determine the unknown quantity. There are four kinematic equations to choose from. In general, you will always choose the equation that contains the three known and the one unknown variable. In this specific case, the three known variables and the one unknown variable are d, vi, a, and t. Thus, you will look for an equation that has these four variables listed in it. An inspection of the four equations above reveals that the equation on the top left contains all four variables. d = vi • t + ½ • a • t2 Once the equation is identified and written down, the next step involves substituting known values into the equation and using proper algebraic steps to solve for the unknown information. This step is shown below. -8.52 m = (0 m/s) • (t) + ½ • (-9.8 m/s2) • (t)2 -8.52 m = (0 m) *(t) + (-4.9 m/s2) • (t)2 -8.52 m = (-4.9 m/s2) • (t)2 (-8.52 m)/(-4.9 m/s2) = t2 1.739 s2 = t2 t = 1.32 s The solution above reveals that the shingles will fall for a time of 1.32 seconds before hitting the ground. (Note that this value is rounded to the third digit.) The last step of the problem-solving strategy involves checking the answer to assure that it is both reasonable and accurate. The value seems reasonable enough. The shingles are falling a distance of approximately 10 yards (1 meter is pretty close to 1 yard); it seems that an answer between 1 and 2 seconds would be highly reasonable. The calculated time easily falls within this range of reasonability. Checking for accuracy involves substituting the calculated value back into the equation for time and insuring that the left side of the equation is equal to the right side of the equation. Indeed it is! Example Problem B Rex Things throws his mother's crystal vase vertically upwards with an initial velocity of 26.2 m/s. Determine the height to which the vase will rise above its initial height. Once more, the solution to this problem begins by the construction of an informative diagram of the physical situation. This is shown below. The second step involves the identification and listing of known information in variable form. You might note that in the statement of the problem, there is only one piece of numerical information explicitly stated: 26.2 m/s. The initial velocity (vi) of the vase is +26.2 m/s. (The + sign indicates that the initial velocity is an upwards velocity). The remaining information must be extracted from the problem statement based upon your understanding of the above principles. Note that the vf value can be inferred to be 0 m/s since the final state of the vase is the peak of its trajectory (see note above). The acceleration (a) of the vase is -9.8 m/s2 (see note above). The next step involves the listing of the unknown (or desired) information in variable form. In this case, the problem requests information about the displacement of the vase (the height to which it rises above its starting height). So d is the unknown information. The results of the first three steps are shown in the table below. Diagram: Given: Find: vi = 26.2 m/s vf = 0 m/s a = -9.8 m/s2 d = ?? The next step involves identifying a kinematic equation that would allow you to determine the unknown quantity. There are four kinematic equations to choose from. Again, you will always search for an equation that contains the three known variables and the one unknown variable. In this specific case, the three known variables and the one unknown variable are vi, vf, a, and d. An inspection of the four equations above reveals that the equation on the top right contains all four variables. vf2 = vi2 + 2 • a • d Once the equation is identified and written down, the next step involves substituting known values into the equation and using proper algebraic steps to solve for the unknown information. This step is shown below. (0 m/s)2 = (26.2 m/s)2 + 2 •(-9.8m/s2) •d 0 m2/s2 = 686.44 m2/s2 + (-19.6 m/s2) •d (-19.6 m/s2) • d = 0 m2/s2 -686.44 m2/s2 (-19.6 m/s2) • d = -686.44 m2/s2 d = (-686.44 m2/s2)/ (-19.6 m/s2) d = 35.0 m The solution above reveals that the vase will travel upwards for a displacement of 35.0 meters before reaching its peak. (Note that this value is rounded to the third digit.) The last step of the problem-solving strategy involves checking the answer to assure that it is both reasonable and accurate. The value seems reasonable enough. The vase is thrown with a speed of approximately 50 mi/hr (merely approximate 1 m/s to be equivalent to 2 mi/hr). Such a throw will never make it further than one football field in height (approximately 100 m), yet will surely make it past the 10-yard line (approximately 10 meters). The calculated answer certainly falls within this range of reasonability. Checking for accuracy involves substituting the calculated value back into the equation for displacement and insuring that the left side of the equation is equal to the right side of the equation. Indeed, it is! Kinematic equations provide a useful means of determining the value of an unknown motion parameter if three motion parameters are known. In the case of a free-fall motion, the acceleration is often known. And in many cases, another motion parameter can be inferred through a solid knowledge of some basic kinematic principles.
Statistics Branch of science that deals with the collection, organization, analysis, interpretation, and presentation of data. Purpose of statistics is to make an inference about a population by examining a sample. Collection of Data Refers to the process of gathering information. Primary source: questionnaires, interviews. Secondary source: journals, books. Presentation of Data Organization and arrangement of data in tabular form (tables), graphical representation (graphs). Analysis of Data Application and interpretation using statistical tools to derive meaning. Inspection of Data Descriptive Statistics: Involves describing the basic features of the data in a study. Provides simple summaries about the sample and measures. Inferential Statistics: Makes judgments and reaches conclusions about populations based on samples. Population vs Sample Population: entirety Sample: only part of population Fundamental or Descriptive Statistics: Measures Of Central Tendency: Mean (average) Median (middle value) Mode (most frequent) Measures Of Dispersion/Variability: Range (difference between highest & lowest) Variance & standard deviation Measures Of Position: Quartiles & percentiles Measures Of Relationship Between Variables: Correlation coefficient Types Of Data: Primary Data – original source. Secondary Data – derived from primary. Major Characteristics Of Data Sources: Primary Source – direct from respondent; more accurate; costly; time-consuming. Secondary Source – characteristic not
Owls, such as the young snowy owls on the previous page, have for centuries been symbols of both wisdom and mystery. To many cultures their piercing eyes have conveyed a look of intelligence. Their silent flight through darkened landscapes in search of prey has projected an air of power or wonder. For this chapter and this book, owls are an engaging example of a living organism from the world of biology—the study of life. BIOLOGY AND YOU Living in a small town, in the country, or at the edge of the suburbs, one may be lucky enough to hear an owl's hooting. This experience can lead to questions about where the bird lives, what it hunts, and how it finds its prey on dark, moonless nights. Biology, or the study of life, offers an organized and scientific framework for posing and answering such questions about the natural world. Biologists study questions about how living things work, how they interact with the environment, and how they change over time. Biologists study many different kinds of living things ranging from tiny organisms, such as bacteria, to very large organisms, such as elephants. Each day, biologists investigate subjects that affect you and the way you live. For example, biologists determine which foods are healthy. As shown in Figure 1-1, everyone is affected by this impor- tant topic. Biologists also study how much a person should exer- cise and how one can avoid getting sick. Biologists also study what CHARACTERISTICS OF LIFE The world is filled with familiar objects, such as tables, rocks, plants, pets, and automobiles. Which of these objects are living or were once living? What are the criteria for assigning something to the living world or the nonliving world? Biologists have established that living things share seven characteristics of life. These characteristics are organization and the presence of one or more cells, response to a stimulus (plural, stimuli), homeostasis, metabolism, growth and development, reproduction, and change through time. Organization and Cells Organization is the high degree of order within an organism’s internal and external parts and in its interactions with the living world. For example, compare an owl to a rock. The rock has a spe- cific shape, but that shape is usually irregular. Furthermore, differ- ent rocks, even rocks of the same type, are likely to have different shapes and sizes. In contrast, the owl is an amazingly organized individual, as shown in Figure 1-2. Owls of the same species have the same body parts arranged in nearly the same way and interact with the environment in the same way. Copyright © by Holt, Rinehart and Winston. All rights reserved. ORGANISM (Barn Owl) ORGAN (Owl’s Ear) TISSUE (Nervous Tissue Within the Ear) CELL (Nerve Cell) your air, land, and fAll living organisms, whether made up of one cell or many cells, have some degree of organization. A cell is the smallest unit that can perform all life’s processes. Some organisms, such as bacteria, are made up of one cell and are called unicellular (YOON-uh-SEL-yoo-luhr) organisms. Other organisms, such as humans or trees, are made up of multiple cells and are called multicellular (MUHL-ti-SEL-yoo-luhr) organisms. Complex multicellular organisms have the level of orga- nization shown in Figure 1-2. In the highest level, the organism is made up of organ systems, or groups of specialized parts that carry out a certain function in the organism. For example, an owl’s ner- vous system is made up of a brain, sense organs, nerve cells, and other parts that sense and respond to the owl’s surroundings. Organ systems are made up of organs. Organs are structures that carry out specialized jobs within an organ system. An owl’s ear is an organ that allows the owl to hear. All organs are made up of tissues. Tissues are groups of cells that have similar abilities and that allow the organ to function. For example, nervous tissue in the ear allows the ear to detect sound. Tissues are made up of cells. A cell must be covered by a membrane, contain all genetic information necessary for replication, and be able to carry out all cell functions. Within each cell are organelles. Organelles are tiny structures that carry out functions necessary for the cell to stay alive. Organelles contain biological molecules, the chemical compounds that provide physical structure and that bring about movement, energy use, and other cellular functions. All biological molecules are made up of atoms. Atoms are the simplest particle of an ele- ment that retains all the properties of a certain element. Response to Stimuli Another characteristic of life is that an organism can respond to a stimulus—a physical or chemical change in the internal or external environment. For example, an owl dilates its pupils to keep the level of light entering the eye constant. Organisms must be able to respond and react to changes in their environment to stay alive. ORGANELLE (Mitochondrion) BIOLOGICAL MOLECULE (Phospholipid) ATOM (Oxygen) cell from the Latin, cella meaning “small room,” or “hut” Word Roots and Origins www.scilinks.org Topic: Characteristics of Life Keyword: HM60257 mb06se_bios01.qxd 5/18/07 10:37 AM Page 7 8 CHAPTER 1 Homeostasis All living things, from single cells to entire organisms, have mecha- nisms that allow them to maintain stable internal conditions. Without these mechanisms, organisms can die. For example, a cell’s water content is closely controlled by the taking in or releas- ing of water. A cell that takes in too much water will rupture and die. A cell that doesn’t get enough water will also shrivel and die. Homeostasis (HOH-mee-OH-STAY-sis) is the maintenance of a stable level of internal conditions even though environmental conditions are constantly changing. Organisms have regulatory systems that maintain internal conditions, such as temperature, water content, and uptake of nutrients by the cell. In fact, multi- cellular organisms usually have more than one way of maintain- ing important aspects of their internal environment. For example, an owl’s temperature is maintained at about 40°C (104°F). To keep a constant temperature, an owl’s cells burn fuel to produce body heat. In addition, an owl’s feathers can fluff up in cold weather. In this way, they trap an insulating layer of air next to the bird’s body to maintain its body temperature. Metabolism Living organisms use energy to power all the life processes, such as repair, movement, and growth. This energy use depends on metabolism (muh-TAB-uh-LIZ-uhm). Metabolism is the sum of all the chemical reactions that take in and transform energy and materials from the environment. For example, plants, algae, and some bacteria use the sun’s energy to generate sugar molecules during a process called photosynthesis. Some organisms depend on obtaining food energy from other organisms. For instance, an owl’s metabolism allows the owl to extract and modify the chemi- cals trapped in its nightly prey and use them as energy to fuel activities and growth. Growth and Development All living things grow and increase in size. Some nonliving things, such as crystals or icicles, grow by accumulating more of the same material of which they are made. In contrast, the growth of living things results from the division and enlargement of cells. Cell division is the formation of two new cells from an existing cell, as shown in Figure 1-3. In unicellular organisms, the primary change that occurs following cell division is cell enlargement. In multi- cellular life, however, organisms mature through cell division, cell enlargement, and development. Development is the process by which an organism becomes a mature adult. Development involves cell division and cell differen- tiation, or specialization. As a result of development, an adult organism is composed of many cells specialized for different func- tions, such as carrying oxygen in the blood or hearing. In fact, the human body is composed of trillions of specialized cells, all of which originated from a single cell, the fertilized egg. This unicellular organism, Escherichia coli, inhabits the human intestines. E. coli reproduces by means of cell division, during which the original cell splits into two identical offspring cells. FIGURE 1-3 Observing Homeostasis Materials 500 mL beakers (3), wax pen, tap water, thermometer, ice, hot water, goldfish, small dip net, watch or clock with a second hand Procedure 1. Use a wax pen to label three 500 mL beakers as follows: 27°C (80°F), 20°C (68°F), 10°C (50°F). Put 250 mL of tap water in each beaker. Use hot water or ice to adjust the tem- perature of the water in each beaker to match the temperature on the label. 2. Put the goldfish in the beaker of 27°C water. Record the number of times the gills move in 1 minute. 3. Move the goldfish to the beaker of 20°C water. Repeat observations. Move the goldfish to the beaker of 10°C. Repeat observations. Analysis What happens to the rate at which gills move when the temp- erature changes? Why? How do gills help fish maintain homeostasis? Quick Lab mb06se_bios01.qxd 5/18/07 10:37 AM Page 8 THE SCIENCE OF LIFE 9 Reproduction All organisms produce new organisms like themselves in a process called reproduction. Reproduction, unlike other characteristics, is not essential to the survival of an individual organism. However, because no organism lives forever, reproduction is essential for the continuation of a species. Glass frogs, as shown in Figure 1-4, lay many eggs in their lifetime. However, only a few of the frogs’ off- spring reach adulthood and successfully reproduce. During reproduction, organisms transmit hereditary informa- tion to their offspring. Hereditary information is encoded in a large molecule called deoxyribonucleic acid, or DNA. A short segment of DNA that contains the instructions for a single trait of an organism is called a gene. DNA is like a large library. It contains all the books—genes—that the cell will ever need for making all the struc- tures and chemicals necessary for life. Hereditary information is transferred to offspring during two kinds of reproduction. In sexual reproduction, hereditary information recombines from two organisms of the same species. The resulting offspring are similar but not identical to their parents. For example, a male frog’s sperm can fertilize a female’s egg and form a single fer- tilized egg cell. The fertilized egg then develops into a new frog. In asexual reproduction, hereditary information from different organisms is not combined; thus the original organism and the new organism are genetically the same. A bacterium, for example, reproduces asexually when it splits into two identical cells. Change Through Time Although individual organisms experience many changes during their lifetime, their basic genetic characteristics do not change. However, populations of living organisms evolve or change through time. The ability of populations of organisms to change over time is important for survival in a changing world. This factor is also impor- tant in explaining the diversity of life-forms we see on Earth today. 1. How does biology affect a person’s daily life? 2. How does biology affect society? 3. Name the characteristics shared by living things. 4. Summarize the hierarchy of organization found in complex multicellular organisms. 5. What are the different functions of homeostasis and metabolism in living organisms? 6. How does the growth among living and nonliv- ing things differ? 7. Why is reproduction an important characteristic of life? CRITICAL THINKING 8. Applying Information Crystals of salt grow and are highly organized. Why don’t biologists con- sider them to be alive? 9. Analyzing Models When a scientist designs a space probe to detect life on a distant planet, what kinds of things should it measure? 10. Making Comparisons Both cells and organisms share the characteristics of life. How are cells and organismsood supply will be like in the near future.EVOLUTION OF LIFE Individual organisms change during their lifetime, but their basic genetic characteristics do not change. However, populations of liv- ing organisms do change through time, or evolve. Evolution, or descent with modification, is the process in which the inherited characteristics within populations change over generations, such that genetically distinct populations and new species can develop. Evolution as a theme in biology helps us understand how the various branches of the “tree of life” came into existence and have changed over time. It also explains how organisms alive today are related to those that lived in the past. Finally, it helps us understand the mechanisms that underlie the way organisms look and behave. Natural Selection The ability of populations of organisms to change over time is important for survival in a changing world. According to the theory of evolution by natural selection, organisms that have certain favorable traits are better able to survive and reproduce success- fully than organisms that lack these traits. One product of natural selection is the adaptation of organisms to their environment. Adaptations are traits that improve an indi- vidual’s ability to survive and reproduce. For example, rabbits with white fur and short ears in a snowy place, such as the one in Figure 1-7a, may avoid predators and frostbitten ears more often than those with dark fur and long ears. Thus, the next generation of rabbits will have a greater percentage of animals carrying the genes for white fur and short ears. In contrast, the brown, long- eared rabbit, as shown in Figure 1-7b, would survive and reproduce more successfully in a hot desert environment. The survival and reproductive success of organisms with favor- able traits cause a change in populations of organisms over gener- ations. This descent with modification is an important factor in explaining the diversity of organisms we see on Earth today. 1. Name three unifying themes found in biology. 2. How is the unity and diversity in the living world represented? 3. Identify the three domains and the kingdoms found in each domain. 4. How are organisms interdependent? 5. Describe why evolution is important in explain- ing the diversity of life. 6. Distinguish between evolution and natural selection. CRITICAL THINKING 7. Applying Information Assign the various top- pings you put on pizza to the appropriate domains and kingdoms of life. 8. Analyzing Graphics According to the “tree” in Figure 1-5, which of these pairs are more closely related: Archaea:Bacteria or Archaea:Eukarya? 9. Making Hypotheses Fossil evidence shows that bats descended from shrewlike organisms that could not fly. Write a hypothesis for how natural selection might have led to flying bats. SECTION 2 REVIEW (a) This short-eared arctic hare, Lepus arcticus, is hidden from predators and protected from frostbite in a snowy environment. (b) The mottled brown coats of desert rabbits blend in with the dirt and dry grasses, and their long ears help them radiate excess heat and thus avoid overheating. FIGURE 1-7 (a) (b) Copyright © by Holt, Rinehart and Winston. All rights reserved. THE SCIENCE OF LIFE 13 TH E STUDY OF BIOLOGY Curiosity leads us to ask questions about life. Science provides a way of answering such questions about the natural world. Science is a systematic method that involves forming and testing hypotheses. More importantly, science relies on evidence, not beliefs, for drawing conclusions. SCIENCE AS A PROCESS Science is characterized by an organized approach, called the scientific method, to learn how the natural world works. The methods of science are based on two important principles. The first principle is that events in the natural world have natural causes. For example, the ancient Greeks believed that lightning and thunder occurred because a supernatural god Zeus hurled thunderbolts from the heavens. By contrast, a scientist considers lightning and thunder to result from electric charges in the atmos- phere. When trying to solve a puzzle from nature, all scientists, such as the one in Figure 1-8, accept that there is a natural cause to solve that puzzle. A second principle of science is uniformity. Uniformity is the idea that the fundamental laws of nature operate the same way at all places and at all times. For example, scientists assume that the law of gravity works the same way on Mars as it does on Earth. Steps of the Scientific Method Although there is no single method for doing science, scientific studies involve a series of common steps. 1. The process of science begins with an observation. An observation is the act of perceiving a natural occurrence that causes someone to pose a question. 2. One tries to answer the question by forming hypotheses (singular, hypothesis). A hypothesis is a proposed explanation for the way a particular aspect of the natural world functions. 3. A prediction is a statement that forecasts what would happen in a test situation if the hypothesis were true. A prediction is recorded for each hypothesis. 4. An experiment is used to test a hypothesis and its predictions. 5. Once the experiment has been concluded, the data are analyzed and used to draw conclusions. 6. After the data have been analyzed, the data and conclusions are communicated to scientific peers and to the public. This way oth- ers can verify, reject, or modify the researcher’s conclusions. SECTION 3 OBJECTIVES ● Outline the main steps in the scientific method. ● Summarize how observations are used to form hypotheses. ● List the elements of a controlled experiment. ● Describe how scientists use data to draw conclusions. ● Compare a scientific hypothesis and a scientific theory. ● State how communication in science helps prevent dishonesty and bias. VOCABULARY scientific method observation hypothesis prediction experiment control group experimental group independent variable dependent variable theory peer review All researchers, such as the one releasing an owl above, use the scientific method to answer the questions they have about nature. FIGURE 1-8 Copyright © by Holt, Rinehart and Winston. All rights reserved. 14 CHAPTER 1 OBSERVING AND ASKING QUESTIONS The scientific method generally begins with an unexplained observa- tion about nature. For example, people have noticed for thousands of years that owls can catch prey in near total darkness. As shown in steps and of Figure 1-9, an observation may then raise ques- tions. The owl observation raises the question: How does an owl detect prey in the dark? FORMING A HYPOTHESIS After stating a question, a biologist lists possible answers to a sci- entific question—hypotheses. Good hypotheses answer a question and are testable in the natural world. For example, as shown in step Figure 1-9, there are several possible hypotheses for the question of how owls hunt at night: (a) owls hunt by keen vision in the dark; (b) owls hunt by superb hearing; or (c) owls hunt by detecting the prey’s body heat. Predicting To test a hypothesis, scientists make a prediction that logically fol- lows from the hypothesis. A prediction is what is expected to hap- pen if each hypothesis were true. For example, if hypothesis (a) is true, (owls hunt by keen night vision) then one can predict that the owl will pounce only on the mouse in either a light or a dark room. If hypothesis (b) is true (owls hunt by hearing), then one can pre- dict that in a lighted room, the owl will pounce closer to the mouse’s head. But, in a dark room, the owl should pounce closer to a rustling leaf attached to the mouse. Finally, if hypothesis (c) is true (owls hunt by sensing body heat), then an owl would strike only the prey no matter the room conditions, because owls hunt by detecting the prey’s body heat. 3 1 2 Copyright © by Holt, Rinehart and Winston. All rights reserved. A scientific study includes observations, questions, hypotheses, predictions, experiments, data analysis, and conclu- sions. A biologist can use the scientific method to set up an experiment to learn how an owl captures prey at night. FIGURE 1-9 1 OBSERVATION Owls capture prey on dark nights. 2 QUESTION How do owls detect prey on dark nights? 3 HYPOTHESES a) Owls hunt in the dark by vision. b) Owls hunt in the dark by hearing. c) Owls hunt in the dark by sensing body heat. THE SCIENCE OF LIFE 15 Notice that these predictions make it difficult to distinguish be- tween the vision and body heat hypotheses. The reason is that both hypotheses predict that the owl could grab the mouse in a dark room. Also, these three hypotheses do not eliminate all other factors that could influence how the owl finds its prey. However, testing predictions can allow one to begin rejecting hypotheses and thus to get closer to determining the answer(s) to a question. DESIGNING AN EXPERIMENT Biologists often test hypotheses by setting up an experiment. Step in Figure 1-9 outlines an experiment to test the hypotheses about how an owl hunts at night. First, experimenters set up a room with an owl perch high on one side and a small trap door on the other side for releasing mice. Then, they tied a leaf to each mouse’s tail with a string and released each mouse into the room. Next, each mouse ran silently across the room, but the leaf trailed behind, making a rustling noise. During half of the trials, the lights were on. During the other half, the room was dark. Technicians videotaped all the action in the chamber with an infrared light, which owls cannot see. The researchers then viewed the videos and measured the position of the owl’s strike relative to each mouse’s head. Performing the Experiment Many scientists use a controlled experiment to test their hypotheses. A controlled experiment compares an experimental group and a control group and only has one variable. The control group pro- vides a normal standard against which the biologist can compare results of the experimental group. The experimental group is iden- tical to the control group except for one factor, the independent variable. The experimenter manipulates the independent variable, sometimes called the manipulated variable. 4 4 EXPERIMENT 5 DATA COLLECTION AND ANALYSIS Measure and compare the distance from the owl’s strike to the mouse and to the leaf in light and dark. 6 CONCLUSION Data supported the hearing hypothesis: Owls hunt in the dark by hearing. prey Test predictions of the three hypotheses. Control: In the light Experimental: In the dark 1 2 3 4 5 6 7 8 9 10 11 Predicting Results Materials 2 Petri dishes with agar, cellophane tape, wax pen Procedure 1. Open one of the Petri dishes, and streak your finger across the surface of the agar. 2. Replace the lid, and seal it with the tape. Label this Petri dish with your name and a number 1. 3. Seal the second Petri dish with- out removing the lid. Label this Petri dish with your name and the number 2. 4. Write a prediction about what will happen in each dish. Store your dishes as your teacher directs. Record your observations. Follow your teacher’s directions for disposal of your dishes. Analysis Was your prediction accurate? What evidence can you cite to support your prediction? If you did not obtain the results you predicted, would you change your testing method or your prediction? Explain. Evaluate the importance of obtaining a result that does not support your prediction. Quick Lab mb06se_bios03.qxd 5/18/07 10:40 AM Page 15 16 CHAPTER 1 The independent variable in the owl experiment is the presence or absence of light. In the owl experiment, the control group hunts in the light, and the experimental group hunts in the dark. In addi- tion to varying the independent variable, a scientist observes or measures another factor called the dependent variable, or respond- ing variable, because it is affected by the independent variable. In the owl experiment, the dependent variable is distance from the owl’s strike to the mouse’s head. Testing the Experiment Some controlled experiments are conducted “blind.” In other words, the biologist who scores the results is unaware of whether a given subject is part of the experimental or control group. This factor helps eliminate experimenter bias. Experiments should also be repeated, because living systems are variable. Moreover, scien- tists must collect enough data to find meaningful results. COLLECTING AND ANALYZING DATA Most experiments measure a variable—the dependent variable. This measurement provides quantitative data, data measured in numbers. For example, in the experiment above, scientists mea- sured the distance of an owl’s strike from the prey’s head in cen- timeters, as shown in step of Figure 1-9. An event’s duration in milliseconds is also an example of quantitative data. Biologists usually score the results of an experiment by using one of their senses. They might see or hear the results of an experiment. Scientists also extend their senses with a micro- scope for tiny objects or a microphone for soft sounds. In the owl experiment, biologists extended their vision with infrared cameras. Analyzing and Comparing Data After collecting data from a field study or an experiment and then organizing it, biologists then analyze the data. In analyzing data, the goal is to determine whether the data are reliable, and whether they support or fail to support the predictions of the hypothesis. To do so, scientists may use statistics to help determine relation- ships between the variables involved. They can then compare their data with other data that were obtained in other similar studies. It is also important at this time to determine possible sources of error in the experiment just per- formed. Scientists usually display their data in tables or graphs when analyzing it. For the owl study, biologists could have made a bar graph such as the one in Figure 1-10, which shows the average distance from the owl’s strike relative to the mouse’s head or the leaf in the light and in the dark. 5 5 0 10 15 20 25 In the light In the dark Average distance from strike (cm) Distance Between Owl Strike and a Mouse or From a Leaf Attached to Mouse 30 Mouse Leaf Mouse Leaf The data below are hypothetical results that might occur from the described owl experiment.The independent variable is the darkness of the room, and the dependent variable is how far the owl struck from the mouse’s head.The data show that the owl strikes more accurately at the mouse in the light but strikes more accurately at the leaf in the dark. FIGURE 1-10 Copyright © by Holt, Rinehart and Winston. All rights reserved. THE SCIENCE OF LIFE 17 DRAWING CONCLUSIONS Biologists analyze their tables, graphs, and charts to draw conclu- sions about whether or not a hypothesis is supported, as shown in step of Figure 1-9. The hypothetical owl data show that in the light, owls struck with greater accuracy at the mouse than at the leaf, but in the dark, owls struck with greater accuracy at the leaf than the mouse. Thus, the findings support the hearing hypothe- sis, but not the vision hypothesis. An experiment can only disprove, not prove, a hypothesis. For example, one cannot conclude from the results that the hearing hypothesis is proven to be true. Perhaps the owl uses an unknown smell to strike at the mouse. One can only reject the vision hypothe- sis because it did not predict the results of the experiment correctly. Acceptance of a hypothesis is always tentative in science. The scientific community revises its understanding of phenomena, based on new data. Having ruled out one hypothesis, a biologist will devise more tests to try to rule out any remaining hypotheses. Making Inferences Scientists often draw inferences from data gathered during a field study or experiment. An inference (IN-fuhr-uhns) is a conclusion made on the basis of facts and previous knowledge rather than on direct observations. Unlike a hypothesis, an inference is not directly testable. In the owl study, it is inferred that the owl detects prey from a distance rather than by direct touch. Applying Results and Building Models As shown in Figure 1-11, scientists often apply their findings to solve practical problems. They also build models to represent or describe things. For example in 1953, James Watson and Francis Crick used cardboard balls and wire bars to build physical models of atoms in an attempt to understand the structure of DNA. Mathematical models are sets of equations that describe how dif- ferent measurable items interact in a system. The experimenter can adjust variables to better model the real-world data. CONSTRUCTING A THEORY When a set of related hypotheses is confirmed to be true many times, and it can explain a great amount of data, scientists often reclassify it as a theory. Some examples include the quantum the- ory, the cell theory, or the theory of evolution. People commonly use the word “theory” in a different way than scientists use the word. People may say “It’s just a theory” suggesting that an idea is untested, but scientists view a theory as a highly tested, generally accepted principle that explains a vast number of observations and experimental data. 6 Copyright © by Holt, Rinehart and Winston. All rights reserved. Biologists often apply their knowledge of the natural world to practical problems. Studies on the owl’s keen ability to locate sounds in space despite background noise are helping biotechnologists and bioengineers develop better solutions for people with impaired hearing, such as the people shown in this picture. FIGURE 1-11 18 CHAPTER 1 COMMUNICATING IDEAS An essential aspect of scientific research is scientists working together. Scientists often work together in research teams or sim- ply share research results with other scientists. This is done by publishing findings in scientific journals or presenting them at sci- entific meetings, as shown in Figure 1-12. Sharing information allows others working independently to verify findings or to con- tinue work on established results. For example, Roger Payne pub- lished the results of his owl experiments in a journal in 1971. Then, other biologists could repeat it for verification or use it to study the mechanisms introduced by the paper. With the growing impor- tance of science in solving societal issues, it is becoming increas- ingly vital for scientists to be able to communicate with the public at large. Publishing a Paper Scientists submit research papers to scientific journals for publica- tion. A typical research paper has four sections. First, the Introduction poses the problem and hypotheses to be investigated. Next, the Materials and Methods describe how researchers proceeded with the experiment. Third, the Results state the findings the experiment presented, and finally, the Discussion gives the significance of the experiment and future directions the scientists will take. Job Description Forensic biolo- gists are scientists who study biological materials to investigate potential crimes and other legal issues against humans and animals. Forensic scientists have knowledge in areas of biology, such as DNA and blood pattern analysis, and work in private sector and public laboratories. Focus On a Forensic Biologist As a law enforcement forensic specialist for the Texas Parks and Wildlife Department, Beverly Villarreal assists the game warden in investigations of fish and wildlife violations, such as illegal hunting and fishing. Villarreal analyzes blood and tissue samples to identify species of animals such as fish, birds, and reptiles. Her work helps game wardens as they enforce state laws regarding hunting and fishing. Most people think of forensic scientists as the glamorous crime investigators on TV, but according to Villarreal real forensic scientists “spend a great deal of time at a lab bench running analysis after analysis.” Many of the methods used in animal forensics, such as DNA sequenc- ing, are also used in human forensics. Education and Skills • High school—three years of science courses and four years of math courses. • College—bachelor of science in biol- ogy, including course work in zoology and genetics, plus experience in per- forming DNA analyses. • Skills—patience, attention to detail, and ability to use fine tools. Careers in BIOLOGY Forensic Biologist For more about careers, visit go.hrw.com and type in the keyword HM6 Careers. www.scilinks.org Topic: Scientific Investigations Keyword: HM61358 mb06se_bios03.qxd 5/18/07 10:40 AM Page 18 THE SCIENCE OF LIFE 19 1. What two principles make the scientific method a unique process? 2. Define the roles of observations and hypotheses in science. 3. Summarize the parts of a controlled experiment. 4. Summarize how we make conclusions about the results of an experiment. 5. Why is the phrase, “it’s just a theory” misleading? 6. Give another example of a conflict of interest. CRITICAL THINKING 7. Making Hypotheses On a nocturnal owl’s skull, one ear points up, and the other ear points down. Suggest a hypothesis for this observation. 8. Designing Experiments Design an experiment to establish if owls hunt by keen sight or hunt by heat seeking. 9. Calculating Information What was the average distance between the owl’s strike and the mouse if the recorded differences in this experiment were 25, 22, 19, 19, and 15? SECTION 3 REVIEW After scientists submit their papers to a scientific journal, the editors of that journal will send the paper out for peer review. In a peer review, scientists who are experts in the field anonymously read and critique that research paper. They determine if a paper pro- vides enough information so that the experiment can be duplicated and if the author used good experimental controls and reached an accurate conclusion. They also check if the paper is written clearly enough for broad understanding. Careful analysis of each other’s research by fellow scientists is essential to making scientific progress and preventing scientific dishonesty. HONESTY AND BIAS The scientific community depends on both honesty and good sci- ence. While designing new studies, experimenters must be very careful to prevent previous ideas and biases from tainting both the experimental process and the conclusions. Scientists have to keep in mind that they are always trying to disprove their favorite ideas. Scientists repeat experiments to verify previous findings. This allows for science to have a method for self-correction and it also keeps researchers honest and credible to their peers in the field. Conflict of Interest For most scientists, maintaining a good reputation for collecting and presenting valid data is more important than temporary prestige or income. So, scientists try to avoid any potential conflicts of interest. For example, a scientist who owns a biotechnology company and manufactures a drug would not be the best researcher to critically test that drug’s safety and effectiveness. To avoid this potential con- flict of interest, the scientist allows an unaffected party, such as a research group, to test the drug’s effectiveness. The threat of a potential scandal based on misleading data or conclusions is a pow- erful force in science that helps keep scientists honest and fair. Scientists present their experiments in various forms. The scientists above are presenting their work in the form of a poster at a scientific meeting. FIGURE 1-12 Copyright © by Holt, Rinehart and Winston. All rights reserved. The Internet can provide a wealth of scientific information for a report, but the information may not always be credible or accurate. You can use the methods above to check the accuracy and credibility of your sources. SCIENCE TECHNOLOGY SOCIETY SCIENCE ON THE INTERNET: A New Information Age I n the past, students research- ing a science topic would typ- ically begin their research by visiting a library to use printed reference materials, such as encyclopedias. Today, most stu- dents research topics by using a computer and searching for information on the Internet. The Internet can provide students with a wealth of infor- mation. But which Web sites have accurate information, and which Web sites do not? Checking Web Addresses Students should use the Web address, or URL, to establish the Web site’s credibility. Usually, the domain name can suggest who has published the Web site. Web sites can be pub- lished by governmental agen- cies (ends in “dot gov” or .gov), by educational institutions (ends in “dot edu” or .edu), by organizations (ends in “dot org” or .org), or by commercial businesses (ends in “dot com” or .com). Government Web sites are usually reliable. Examples of credible governmental Web sites are the National Institutes of Health (NIH) and the Food and Drug Administration (FDA). University and medical school sites are also reliable sources of information. Many organiza- tions that research and teach the public about specific diseases and conditions can also provide reliable information. Examples of such organizations are the American Cancer Society and the American Heart Association. Evaluating Web Sites The credibility of the author of the Web site should also be checked. Make sure the author is not trying to sell anything and is established in his or her field. For example, a health Web site’s author should be a med- ical professional. It is also important to check the date that the information was posted on the Web to ensure that the information is current. Also, the Web site should provide ref- erences from valid sources, such as scientific journals or govern- ment publications. Finally, the student should always double-check informa- tion between several reliable Web sites. If two or three reliable sites provide the same informa- tion, the student can feel confi- dent in using that information. Web Sites for Students The Internet Connect boxes in this textbook have all been reviewed by professionals at the National Science Teachers Association (NSTA). Students can trust that these sites are reliable sources for science- or health-related topics. REVIEW 1. Which types of Web addresses are the most reliable? 2. List four important features to evaluate when using a Web site for research. 3. Supporting Reasoned Opinions Why do you think a Web site that is advertising a product may not offer accurate information? REVIEW 20 www.scilinks.org Topic: Using the Internet Keyword: HM61589 mb06se_biosts.qxd 5/18/07 10:42 AM Page 20 TOOLS AND TECHNIQUES With proper equipment and good methods, biologists can see, manipulate, and understand the natural world in new ways. Microscopes are one of many useful tools used to unlock nature’s biological secrets. MICROSCOPES AS TOOLS Tools are objects used to improve the performance of a task. Microscopes are tools that extend human vision by making enlarged images of objects. Biologists use microscopes to study organisms, cells, cell parts, and molecules. Microscopes reveal details that otherwise might be difficult or impossible to see. Light Microscopes To see small organisms and cells, biologists typically use a light microscope, such as the one shown in Figure 1-13. A compound light microscope is a microscope that shines light through a spec- imen and has two lenses to magnify an image. To use this micro- scope, one first mounts the specimen to be viewed on a glass slide. The specimen must be thin enough for light to pass through it. For tiny pond organisms, such as the single-celled paramecium, light passing through the organism is not a problem. For thick objects, such as plant stems, biologists must cut thin slices for viewing. There are four major parts of a compound light microscope. For further description of the parts of a micro- scope, see the Appendix. 1. Eyepiece The eyepiece (ocular (AHK-yoo-luhr) lens) magnifies the image, usually 10 times. 2. Objective Lens Light passes through the specimen and then through the objective lens, which is located directly above the specimen. The objective lens enlarges the image of the specimen. Scientists sometimes use stains to make the image easier to see. 3. Stage The stage is a platform that supports a slide holding the specimen. The slide is placed over the opening in the stage of the microscope. 4. Light Source The light source is a light bulb that provides light for viewing the image. It can be either light reflected with a mirror or an incandescent light from a small lamp. SECTION 4 OBJECTIVES ● List the function of each of the major parts of a compound light microscope. ● Compare two kinds of electron microscopes. ● Describe the importance of having the SI system of measurement. ● State some examples of good laboratory practice. VOCABULARY compound light microscope eyepiece (ocular lens) objective lens stage light source magnification nosepiece resolution scanning electron microscope transmission electron microscope metric system base unit Compound light microscopes open the human eye to an interesting world including tiny pond organisms, healthy and diseased cells, and the functioning of cell parts. FIGURE 1-13 Objective lens Eyepiece (ocular lens) Stage Light THE SCIENCE OF LIFE 21 Copyright © by Holt, Rinehart and Winston. All rights reserved. 22 CHAPTER 1 Magnification and Resolution Microscopes vary in powers of magnification and resolution. Magnification is the increase of an object’s apparent size. Revolving the nosepiece, the structure that holds the set of objective lens, rotates these lenses into place above the specimen. In a typical com- pound light microscope, the most powerful objective lens produces an image up to 100 times (100) the specimen’s actual size. The degree of enlargement is called the power of magnification of the lens. The standard ocular lens magnifies a specimen 10 times (10). To compute the power of magnification of a microscope, the power of magnification of the strongest objective lens (in this case, 100) is multiplied by the power of magnification of the ocular lens (10). The result is a total power of magnification of 1000. Resolution (REZ-uh-LOO-shuhn) is the power to show details clearly in an image. The physical properties of light limit the ability of light microscopes to resolve images, as shown in Figure 1-14a. At pow- ers of magnification beyond about 2,000, the image of the speci- men becomes fuzzy. For this reason, scientists use other microscopes to view very small cells
Python basic print, input keyword commands and variable names
Home Work - Week 7 -Programming Basics - Variables, Inputs and Operators
Soils Southeast Asia, on balance, has a higher proportion of relatively fertile soils than most tropical regions, and soil erosion is less severe than elsewhere. Much of the region, however, is covered by tropical soils that generally are quite poor in nutrients. Often the profusion of plant life is more related to heat and moisture than to soil quality, even though these climatic conditions intensify both chemical weathering and the rate of bacterial action that usually improve soil fertility. Once the vegetation cover is removed, the supply of humus quickly disappears. In addition, the often heavy rainfall leaches the soils of their soluble nutrients, hastens erosion, and damages the soil texture. The leaching process in part results in laterites of reddish clay that contain hydroxides of iron and alumina. Laterite soils are common in parts of Myanmar, Thailand, and Vietnam and also occur in the islands of the Sunda Shelf, notably Borneo. The most fertile soils occur in regions of volcanic activity, where the ejecta is chemically alkaline or neutral. Such soils are found in parts of Sumatra and much of Java in Indonesia. The alluvial soils of the river valleys also are highly fertile and are intensively cultivated. Climate All of Southeast Asia falls within the warm, humid tropics, and its climate generally can be characterized as monsoonal (i.e., marked by wet and dry periods). Changing seasons are more associated with rainfall than with temperature variations. There is, however, a high degree of climatic complexity within the region. Temperatures Regional temperatures at or near sea level remain fairly constant throughout the year, although monthly averages tend to vary more with increasing latitude. Thus, with the exception of northern Vietnam, annual average temperatures are close to 80 °F (27 °C). Increasing elevation acts to decrease average temperatures, and such locations as the Cameron Highlands in peninsular Malaysia and Baguio in the Philippines have become popular tourist destinations in part because of their relatively cooler climates. Proximity to the sea also tends to moderate temperatures. Precipitation Much of Southeast Asia receives more than 60 inches (1,500 millimeters) of rainfall annually, and many areas commonly receive double and even triple that amount. The rainfall pattern is distinctly affected by two prevailing air currents: the northeast (or dry) monsoon and the southwest (or wet) monsoon. The northeast monsoon occurs roughly from November to March and brings relatively dry, cool air and little precipitation to the mainland. As the southwestward-flowing air passes over the warmer sea, it gradually warms and gathers moisture. Precipitation is especially heavy where the airstream is forced to rise over mountains or encounters a landmass. The east coast of peninsular Malaysia, the Philippines, and parts of eastern Indonesia receive the heaviest rains during this period. The southwest monsoon prevails from May to September, when the air current reverses and the dominant flow is to the northeast. The mainland receives the bulk of its rainfall during this period. Over much of the southern Malay Peninsula and insular Southeast Asia there is little or no prolonged dry season. This is especially marked in much of the equatorial region and along the east coast of the Philippines. While the dry and wet monsoons are important in explaining rainfall patterns, so too are such factors as relief, land and sea breezes, convectional overturning and cyclonic disturbances. These factors often are combined with monsoonal effects to produce highly variable rainfall patterns over relatively short distances. While many of the cyclonic disturbances produce only moderate rainfall, others mature into tropical storms—called cyclones in the Indian Ocean and typhoons in the Pacific—that bring heavy rains and destruction to the areas over which they pass. The Philippines are particularly affected by these storms. Plant life Tropical forests in Southeast Asia Tropical forests in Southeast Asia The seasonal nature and pattern of Southeast Asia’s rainfall, as well as the region’s physiography, have strongly affected the development of natural vegetation. The hot, humid climate and enormous variety of habitats have given rise to an abundance and diversity of vegetative forms unlike that in any other area of the world. Much of the natural vegetation has been modified by human action, although large areas of relatively untouched land still can be found. The vegetation can be grouped into two broad categories: the tropical-evergreen forests of the equatorial lowlands and the open type of tropical-deciduous, or “monsoon,” forests in areas of seasonal drought. The evergreen forests are characterized by multiple stories of vegetation, consisting of a variety of trees and plants. Although a large diversity of tree species is found in these forests, members of the Dipterocarpaceae family account for roughly half of the varieties. Deciduous forests are found in eastern Indonesia and those parts of the mainland where annual rainfall does not exceed 80 inches. Just as in the equatorial forest, a wide variety of species is normally the rule. Certain species, such as teak, have become highly valued commercially. Teak is found in parts of Indonesia, Myanmar, Thailand, and Laos. In addition to these two basic types of vegetation, other regional patterns reflect topography. Especially noteworthy are coastal and highland plant communities. Mangrove belts, of which there are more than 30 varieties, occur where silt is deposited in coastal areas. Upland forests dominated by maples, oaks, and magnolias are found especially on mainland mountain slopes. Human activity has been rapidly altering the stands of virgin forest in Southeast Asia. Most deforestation results from removal for fuelwood and clearing for agriculture and grazing. Although only a relatively small portion of the total land area has been permanently cleared for cultivation—e.g., in Java (Indonesia) and western Luzon (the Philippines)—in some areas shifting cultivation has brought about the replacement of virgin forest with secondary growth. In addition, nearly all countries have commercial logging industries; notable are those in Indonesia, Malaysia, Thailand, and Myanmar. A growing problem has been illegal logging. Thus, timber harvesting has come to contribute significantly to deforestation. Programs in social forestry and reforestation have yet to halt the rapid denuding of the landscape. Animal life Southeast Asia is situated where two major divisions of the world’s fauna meet. The region itself constitutes the eastern half of what is called the Oriental, or Indian, zoogeographic region (part of the much larger realm of Megagaea). Bordering along the south and east is the Australian zoogeographic region, and the eastern portion of insular Southeast Asia—Celebes (Sulawesi), the Moluccas, and the Lesser Sunda Islands—constitutes a transition zone between these two faunal regions. a classroom in Brazil More From Britannica education: Southeast Asia Southeast Asia is notable, therefore, for a considerable diversity of wildlife throughout the region. These differences are especially striking between the species of the eastern and western fringes as well as between those of the archipelagic south and the mainland north. The differences stem largely from the isolation, over varying lengths of geologic time, of species following their migration from the Asian continent. In addition, the tropical rain forests in many parts of the region, with their great diversity of vegetation, have made possible the development of complex communities of animals that fill specialized ecological niches. Especially numerous are arboreal and flying creatures. orangutans orangutansOrangutans (Pongo pygmaeus) in Sumatra, Indonesia. The distinction between the two faunal regions is best depicted by their mammal populations. In general, Australia is inhabited largely by marsupials (pouched mammals) and monotremes (egg-laying mammals), while Southeast Asia contains placental mammals and such hybrid species as the bandicoot of eastern Indonesia. Small mammals such as monkeys and shrews are the most numerous, while in many areas the larger mammals have been pushed into more remote areas and national preserves. Bears, gibbons, elephants, deer, civets, and pigs are found in both mainland and insular Southeast Asia, as are diminishing numbers of tigers. The Malayan tapir, a relative of the rhinoceros, is native to the Malay Peninsula and Sumatra, while the tarsier is found in the Philippines and parts of Indonesia. A number of rare endemic species are found in Indonesia and East (insular) Malaysia, including the Sumatran and Javan rhinoceros, the orangutan, the anoa (a dwarf buffalo), the babirusa (a wild swine), and the palm civet. As the pace of development accelerates and populations continue to expand in Southeast Asia, concern has increased regarding the impact of human activity on the region’s environment. A significant portion of Southeast Asia, however, has not changed greatly and remains an unaltered home to wildlife. The nations of the region, with only few exceptions, have become aware of the need to maintain forest cover not only to prevent soil erosion but to preserve the diversity of flora and fauna. Indonesia, for example, has created an extensive system of national parks and preserves for this purpose. Even so, such species as the Javan rhinoceros face extinction, with only a handful of the animals remaining in western Java
Grade 9 python basics quiz (Include variable declaration, assignment, operators, and conditionals - No loops)
VARIABLES and OPERATORS in Java