Loading...
Volume of Square Pyramid
Quiz by Rondel John Forjes
Customize this quiz to suit your class
Instantly translate to 100+ languages
Tag the questions with any skills you have. Your dashboard will track each student's mastery of each skill.
Give this quiz to my class
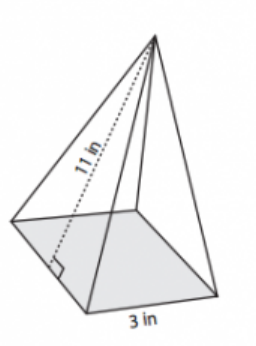
Find the volume of the given square pyramid.
33 in3
35in3
44in3
45in3
A grade 6 AIS learner created a square pyramid model made out of recycled materials. The side length is 3in and the height is 9in. What is the volume of the pyramid?
29in3
30in3
28in3
27in3
Find the volume of the given square pyramid.

A grade 6 AIS learner created a square pyramid model made out of recycled materials. The side length is 3in and the height is 9in. What is the volume of the pyramid?
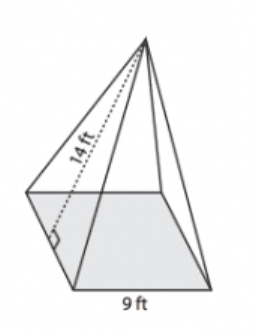
Find the volume of the figure