Loading...
WEEK 2 PISA QUESTIONS AND SUMMATIVE TEST - MATHEMATICS 7
Quiz by Kathlyn Joy Becong
Tag the questions with any skills you have. Your dashboard will track each student's mastery of each skill.
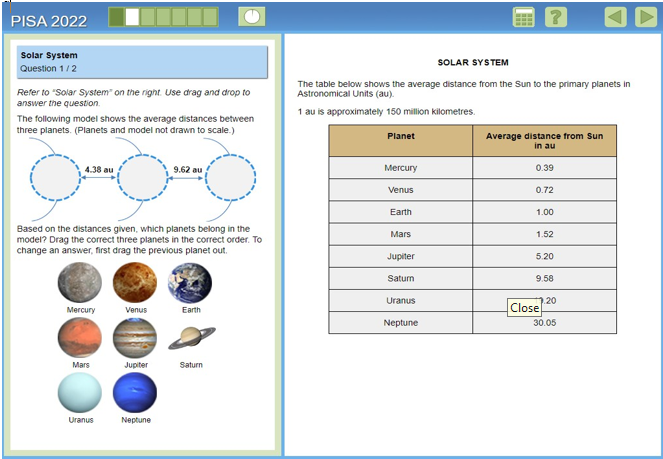
Based on the distances given, which planets belong in the model?
Jupiter-Mars-Earth
Jupiter-Saturn-Earth
Jupiter-Uranus-Saturn
Jupiter-Saturn-Uranus
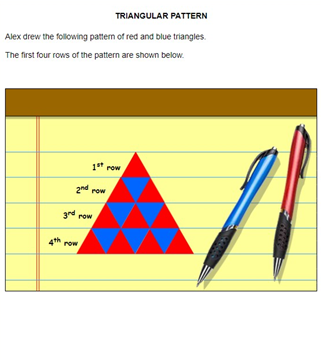
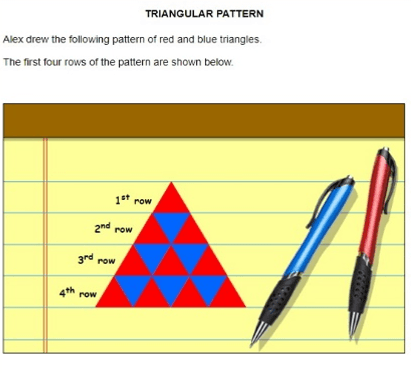
What percentage of the triangles in the first four rows of Alexa's pattern are blue?
60.0%
62.5%
50.0%
37.5%
Based on the distances given, which planets belong in the model?

What percentage of the triangles in the first four rows of Alexa's pattern are blue?

On average, approximately how many million kilometers from the Sun is the planet Neptune?

If Alex were to extend the pattern to a fifth row, what would be the percentage of blue triangles in all five rows of the pattern?

Alex is going to add more rows to his pattern. He claims that the percentage of blue triangles in the pattern will always be less than 50%. Is Alex correct?
Given the average margin of victory for the season, is it possible that the team never actually won a game by 19 points?

In terms of percentage points, which country had the greatest gain between 2005 and 2015?

Which country had no overall change between 2005 and 2015?
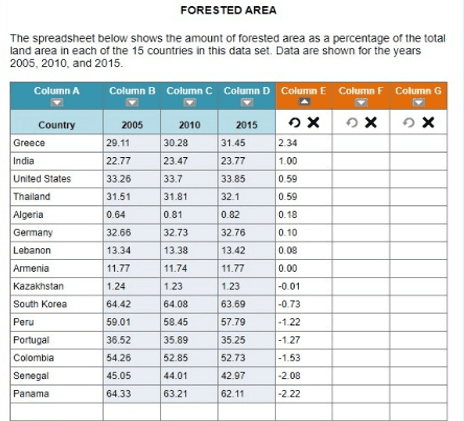
In terms of percentage points, which country had the greatest loss between 2005 and 2015?

Consider the two time periods: 2005 to 2010 and 2010 to 2015. Which one of the following statements correctly describes the mean change in the percentage of forested area for both time periods?

Consider the two time periods: 2005 to 2010 and 2010 to 2015. In terms of percentage points, which two countries had the biggest change in the percent of forested area from on e time period to the other time period?
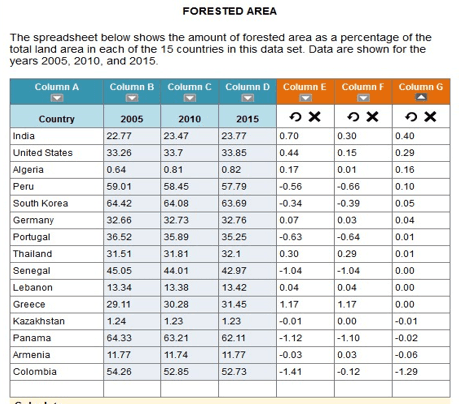
Helena claims that South Korea has more forested area than any other country in this list for the years shown. Is her claim supported by the data in the spreadsheet?

It is a decimal system of measurement for length, volume and weight.
Convert 2.3 meters to centimeters.
It is used to measure the duration of events happening around us.
Aj watched cartoons for 3 hours every day. How many minutes did he spend watching cartoons?
Mark jumps a distance of 12.7 meters, convert this into millimeters.
Given a cylinder with a radius of 3 cm and height of 5 cm. Calculate the volume.
A cylindrical water tank has a radius of 2meters and a height of 6 meters. How much water can it
A three-dimensional geometric shape that has a rectangular base and four triangular faces (lateral faces) that are joined at the top by a vertex or apex.