Analyze linear, exponential, and quadratic functions by generating different representations, by hand in simple cases and using technology for more complicated cases, to show key features, including: domain and range; rate of change; intercepts; intervals where the function is increasing, decreasing, positive, or negative; maximums and minimums; and end behavior.
Interpret key features of graphs, tables, and verbal descriptions in context to describe functions that arise in applications relating two quantities, including: intercepts; intervals where the function is increasing, decreasing, positive, or negative; and maximums and minimums.
Calculate and interpret the average rate of change over a specified interval for a function presented numerically, graphically, and/or symbolically.
Track each student's skills and progress in your Mastery dashboards
Give this quiz to my class
Q 1/4
Score 0
300
Q 2/4
Score 0
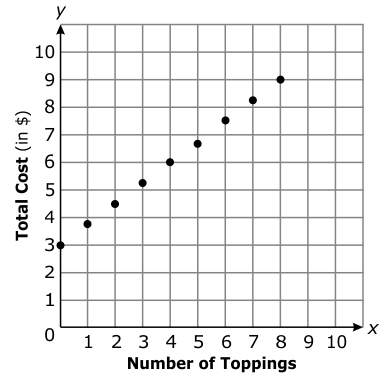
The scatterplot below shows the number of toppings, x, and the total cost, y, of a cup of ice cream. Which statement best represents the graph?
300
A cup of ice cream costs $0.75 plus $3.00 for each topping.
A cup of ice cream costs $3.00 plus $1.50 for each topping.
A cup of ice cream costs $1.50 plus $3.00 for each topping.
A cup of ice cream costs $3.00 plus $0.75 for each topping.
4 questions
Q.
1
300 sec
NC.M1.F-IF.7
Q.
The scatterplot below shows the number of toppings, x, and the total cost, y, of a cup of ice cream. Which statement best represents the graph?
2
300 sec
NC.M1.F-IF.4
Q.
The table shows the time, in hours, Dara spent writing her book last week and the total number of pages she wrote. What is the meaning of the slope of the line that represents the table?
3
300 sec
NC.M1.F-IF.4
Q.
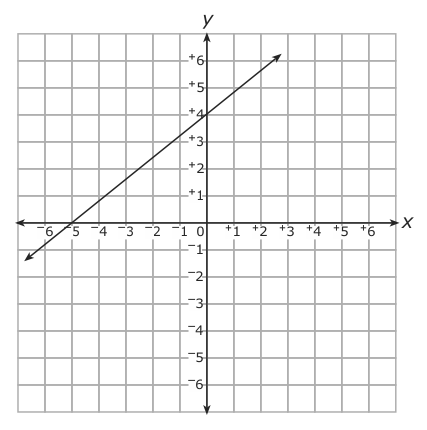
What is the slope of the dashed line on the graph?