Loading...
1st Quarter Remedial Exam in Mathematics
Quiz by Bea Bernadith Ramos
Tag the questions with any skills you have. Your dashboard will track each student's mastery of each skill.
How can a group of objects with a common characteristic be referred as?
Given that:
A = {1, 3, 5, 7, 9, 11, 13, 15}
What is the cardinality of the set?
A given set is defined as B = {a, e, i, o, u}. How was the set defined?
Given that a set is defined as C ={x|x is an even prime number, x < 18}, what method was used?
How can a set of all odd numbers less than 15 be represented?
How can a set of all vowels in the English alphabet be represented?
Given that
A = {1, 2, 3, 4, 5}
B = {6, 7, 8, 9, 10}
What is the union of set A and set B?
Given that
A = {a, b, c, d, e}
B = {f, g, h, i, j, k}
What is the union of set A and set B?
Given that
A = {1, 2, 3}
B = {4, 5, 6}
C = {7, 8, 9, 10}
What will be the elements of the universal set?
Given that A ={a, b, c, d, e} and B = {a, c, g}, the intersection of these sets will have the elements {a, c}. What does intersection of sets mean?
Which of the following is as subset of A = {l, o, v, e}?
Which of the following is NOT a subset of B = {b, u, r, n}?
TRUE OR FALSE
A singleton set is characterized by a single element in a set.
TRUE OR FALSE
An empty set, also known as a null set, will always be a subset of any set.
TRUE OR FALSE
An ellipsis used in representing a set can be an indication that it is an infinite set.
The Venn diagram shows the survey done among 40 students on the pet that they already had. Based on the diagram, answer the following question.
How many students had cats ONLY as their pet?
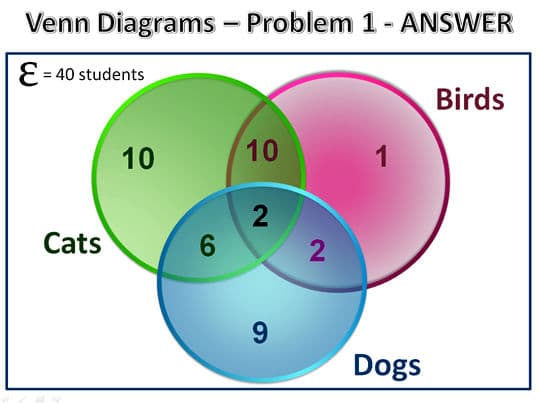
The Venn diagram shows the survey done among 40 students on the pet that they already had. Based on the diagram, answer the following question.
How many students had dogs ONLY as their pet?
The Venn diagram shows the survey done among 40 students on the pet that they already had. Based on the diagram, answer the following question.
How many students had birds ONLY as their pet?
The Venn diagram shows the survey done among 40 students on the pet that they already had. Based on the diagram, answer the following question.
How many students had both cats and dogs as their pet?
The Venn diagram shows the survey done among 40 students on the pet that they already had. Based on the diagram, answer the following question.
How many students had cats, dogs, and birds as their pet?
The Venn Diagram shows a survey done with 90 students on what subject they prefer between Math and Science. Based on the diagram, answer the following.
How many students prefer Science?

The Venn Diagram shows a survey done with 90 students on what subject they prefer between Math and Science. Based on the diagram, answer the following.
How many students prefer Math?
The Venn Diagram shows a survey done with 90 students on what subject they prefer between Math and Science. Based on the diagram, answer the following.
How many students prefer both Math and Science?
The Venn Diagram shows a survey done with 90 students on what subject they prefer between Math and Science. Based on the diagram, answer the following.
How many students prefer other subjects than Math and Science?
How did Venn diagrams help in representing gathered information?