Our brand new solo games combine with your quiz, on the same screen

Correct quiz answers unlock more play!

New Quizalize solo game modes
13 questions
Show answers
  • Q1

    3: Weather variables are measured every day at locations around the world.

    true
    false
    True or False
    30s
  • Q2

    3: Modern weather forecasts are created using computers.

    true
    false
    True or False
    30s
  • Q3

    3: Which diagram shows surface weather measurements?

    a station model

    an upper air chart

    a visible light satellite image

    an infrared satellite image

    120s
  • Q4

    3: Which contains measurements of temperature, air pressure, humidity, precipitation, and wind speed and direction?

    a surface report

    a satellite image

    a radar image

    a weather station

    120s
  • Q5

    3: What does Doppler radar measure?

    the rate at which air pressure changes

    air pressure

    the speed at which precipitation travels

    air temperature

    120s
  • Q6

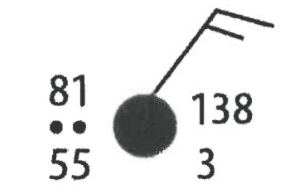
    3: What is the temperature according to the station model shown?

    Question Image

    138°F

    55°F

    3°F

    81°F

    120s
  • Q7

    3: Which measures air pressure?

    barometer

    thermometer

    psychrometer

    anemometer

    120s
  • Q8

    3: When isobars are close together on a weather map, this means....

    winds are strong

    warm fronts prevail

    temperatures are high

    cloud cover is extensive

    120s
  • Q9

    How is radar able to measure precipitation?

    Radio waves are bounced off a weather ballon; any form of precipitation will interrupt the signal.

    A radiosonde in the atmosphere sends back the data via radar link.

    Radar measures the wind speed, which slows down when carrying rain.

    Radio waves will bounce off the raindrops and reflect back.

    120s
  • Q10

    What is a surface report?

    detailed map of the surface provided by satellites

    measurements taken only by human observers to prevent error

    a set of weather measurements taken on the surface of Earth

    a brief report of collected data

    120s
  • Q11

    Where are the isobars located in this figure, and what do they represent?

    Question Image

    Isobars are lines with half-circles and triangles and are used to measure the exact wind speed and air pressure.

    Isobars have dots with flags attached and are an important part of the Doppler radar system.

    Isobars connect areas of the same pressure. They show the location of high- and low-pressure systems in the figure.

    Isobars are the L's and H's on the map and indicate high-pressure or low-pressure areas.

    120s
  • Q12

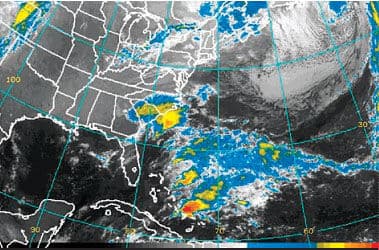
    What information can be gathered from the colors in this infrared image?

    Question Image

    Bright colors indicate cities below the clouds.

    Colors indicate a large mass of warm clouds with a center of heavy rain.

    A bright spot means a high chance of rain.

    Brighter colors indicate warmer air.

    120s
  • Q13

    What method is used to collect information for an upper-air report?

    measurements taken by Doppler radar and infrared

    human observers measuring cloud formations from the ground

    analysis of wind movement collected by at least three ground stations

    measurements taken by radiosonde instruments

    120s

Teachers give this quiz to your class