represent categorical data with bar graphs or frequency tables and numerical data, including data sets of measurements in fractions or decimals, with dot plots or stem-and-leaf plots
Track each student's skills and progress in your Mastery dashboards
Loading...
Loading...
Loading...
Give this quiz to my class
Q 1/2
Score 0
60
Q 2/2
Score 0
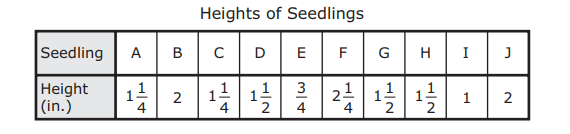
The table shows the heights of 10 seedlings. Which dot plot represents these data?
60
2 questions
Q.
1
60 sec
5.9.A: Data Analysis
Q.
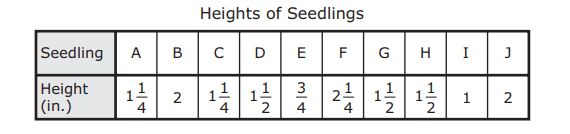
The table shows the heights of 10 seedlings. Which dot plot represents these data?