Track each student's skills and progress in your Mastery dashboards
Loading...
Loading...
Loading...
Give this quiz to my class
Q 1/2
Score 0
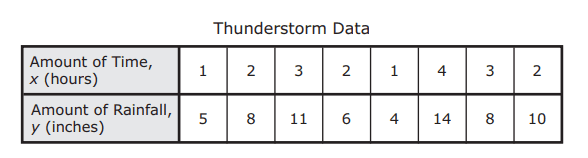
The table shows the amount of time eight thunderstorms lasted and the amount of rainfall each thunderstorm produced. Which scatterplot best represents the data? Which scatterplot best represents the data?
60
Q 2/2
Score 0
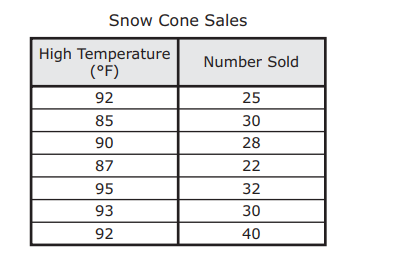
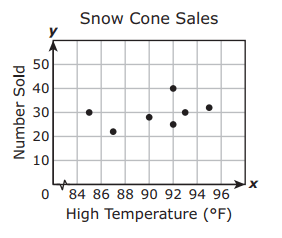
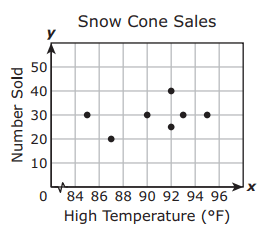
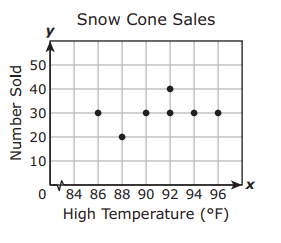
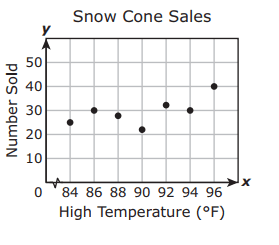
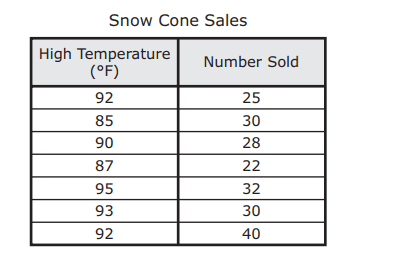
The table shows the high temperatures and the numbers of snow cones sold at a snack bar on seven days. Which scatterplot best represents the data in the table?
60
2 questions
Q.
The table shows the amount of time eight thunderstorms lasted and the amount of rainfall each thunderstorm produced. Which scatterplot best represents the data? Which scatterplot best represents the data?
1
60 sec
5.9.B: Data Analysis
Q.
The table shows the high temperatures and the numbers of snow cones sold at a snack bar on seven days. Which scatterplot best represents the data in the table?