represent numeric data graphically, including dot plots, stem-and-leaf plots, histograms, and box plots
Track each student's skills and progress in your Mastery dashboards
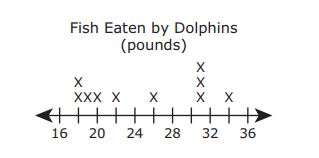
The line plot shows the number of pounds of fish eaten by each dolphin at a zoo. Which stem and leaf plot best represents the data in the line plot?#texas/961d1c4c-0985-433f-a5b7-15629c912562/D.png
#texas/961d1c4c-0985-433f-a5b7-15629c912562/A.png
#texas/961d1c4c-0985-433f-a5b7-15629c912562/C.png
#texas/961d1c4c-0985-433f-a5b7-15629c912562/B.png