interpret numeric data summarized in dot plots, stem-and-leaf plots, histograms, and box plots
Track each student's skills and progress in your Mastery dashboards
Give this quiz to my class
Q 1/5
Score 0
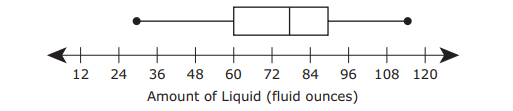
Students recorded the amount of liquid in fluid ounces each of them drank in one day. The box plot shows the summary of the results. Which statement best describes the data represented in the box plot?
60
The mean number of fluid ounces that the students drank is 78.
The data represent 78 student responses.
Half the students drank from 78 to 114 fluid ounces.
The greatest number of students drank from 30 to 78 fluid ounces.
Q 2/5
Score 0
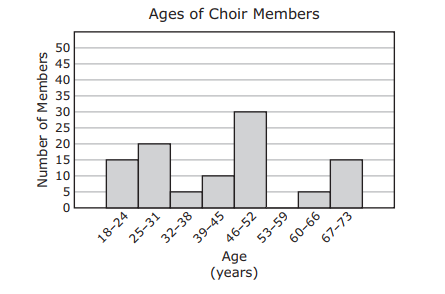
A choir director made a histogram showing the ages of the members of the choir. Which statement about the data in the histogram must be true?
60
The choir has a total of 100 members.
Exactly 20 members are less than 32 years old.
More than half the members are from 46 to 73 years old.
There are more men than women in the choir.
5 questions
Q.
Students recorded the amount of liquid in fluid ounces each of them drank in one day. The box plot shows the summary of the results. Which statement best describes the data represented in the box plot?
1
60 sec
6.13.A: Measurement and Data
Q.
A choir director made a histogram showing the ages of the members of the choir. Which statement about the data in the histogram must be true?
2
60 sec
6.13.A: Measurement and Data
Q.
The histogram shows the total number of swimmers in different age groups who participated in a swimming competition. Based on the histogram, which statement is true?
3
60 sec
6.13.A: Measurement and Data
Q.
The box plots summarize the attendance for the spring musical and the fall musical. Each musical was performed for six evenings. Which statement best describes the data represented in the box plots?
4
60 sec
6.13.A: Measurement and Data
Q.
The total number of items sold by each student who participated in a fund-raiser is shown in the stem and leaf plot. Which statement is best supported by the data in the stem and leaf plot?