compare two groups of numeric data using comparative dot plots or box plots by comparing their shapes, centers, and spreads
Track each student's skills and progress in your Mastery dashboards
Give this quiz to my class
Q 1/10
Score 0
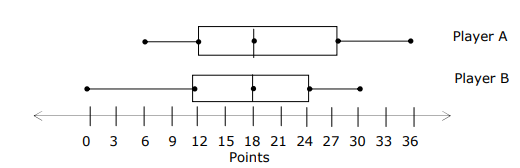
The box plots compare the number of points two basketball players scored per game over 25 games last season. Which statement is supported by the information in the box plots?
300
Player A and B each scored 36 points in at least of the 25 games
Player A scored points in all 25 games but Player B did not
Player A has a larger range in the points he scored than Player B
Player A has a larger median than Player B
Q 2/10
Score 0
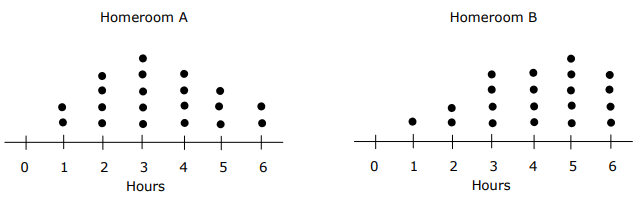
The dot plots show the numbers of hours students in two homerooms spent on homework each week. Which statement is supported by the information in the dot plots?
300
Homeroom A has larger range in hours they spend on homework than Homeroom B has in the hours they spend on homework
Homeroom A had more than half of their students spending 4 or more hours on homework and Homeroom B had more than two-thirds of their students spending 4 or more more hours on homework
Homeroom A has more students spending 2, 3, or 4 hours on homework than Homeroom B had students spending 4, 5 or 6 hours on homework
Homeroom A has a median of 3 and Homeroom B has a median of 4
10 questions
Q.
The box plots compare the number of points two basketball players scored per game over 25 games last season. Which statement is supported by the information in the box plots?
1
300 sec
7.12.A: Measurement and Data
Q.
The dot plots show the numbers of hours students in two homerooms spent on homework each week. Which statement is supported by the information in the dot plots?
2
300 sec
7.12.A: Measurement and Data
Q.
The box plot shows that lengths of two songs on two digital music players in minutes. Which statement is best supported by the information in the box plots?
3
300 sec
7.12.A: Measurement and Data
Q.
Waldo and Freddy caught fish one weekend. The dot plot shows the lengths of the fish they caught, Which statement is about the lengths of the fish caught by Waldo and Freddy appears to be true?
4
300 sec
7.12.A: Measurement and Data
Q.
Mrs. Kelso and Mr. Bonham gave each of their students a small bag of colored tiles. The students each counted the number of purple tiles they received. The box plots display the data for both classes. Which statement is best supported by the information in the box plots?
5
300 sec
7.12.A: Measurement and Data
Q.
The dot plot shows the heights of players on two basketball teams. Which statement is best supported by these data?
6
300 sec
7.12.A: Measurement and Data
Q.
The number of pets per household for Mrs. Anderson’s class and Mrs. Murphy’s class are shown in the dot plots. Here are three statements about the number of pets per household for these two classes. Which of these three statements appear to be true?
7
300 sec
7.12.A: Measurement and Data
Q.
The box plots show data about the number of years that farm workers have been employed at each of two farms. Which statement is best supported by the information in the box plots?
8
300 sec
7.12.A: Measurement and Data
Q.
How do you find the mean of a numerical data set?
9
120 sec
7.12.A: Measurement and Data
Q.
How do you find the range of a numerical data set?