compare two populations based on data in random samples from these populations, including informal comparative inferences about differences between the two populations
Track each student's skills and progress in your Mastery dashboards
Q 1/1
Score 0
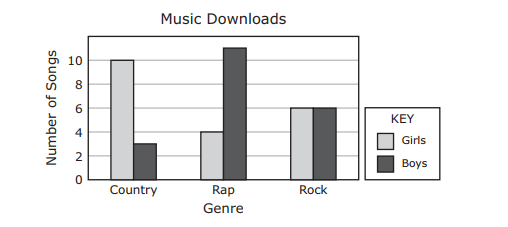
Parker conducted a random survey at the mall to determine the number of songs in each genre that were downloaded by 40 students. The results are shown in the bar graph. Based on the information in the graph, which inference about the general population of students is valid?
60
More girls than boys like rock music.
Girls like country music more than all other genres combined.
Boys like rock music more than girls like rap music.
Boys like country music more than rock music.
Loading...
Loading...
1 question
Q.
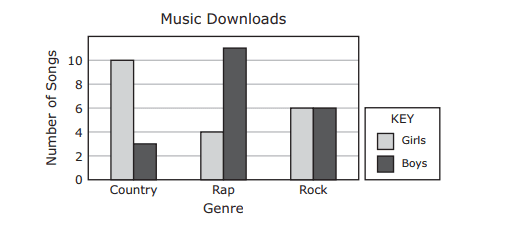
Parker conducted a random survey at the mall to determine the number of songs in each genre that were downloaded by 40 students. The results are shown in the bar graph. Based on the information in the graph, which inference about the general population of students is valid?