Write and solve equations involving direct variation.
Track each student's skills and progress in your Mastery dashboards
Give this quiz to my class
Q 1/11
Score 0
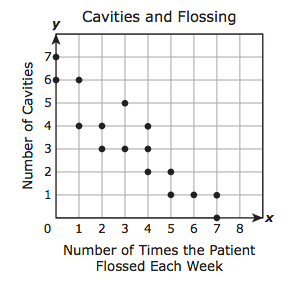
A dentist made the scatterplot below to show the number of cavities her patients had as it relates to the number of times they flossed their teeth each week. Which of the following best describes the correlation for the data?
45
Negative correlation
No correlation
Nonlinear correlation
Positive correlation
Q 2/11
Score 0
60
11 questions
Q.
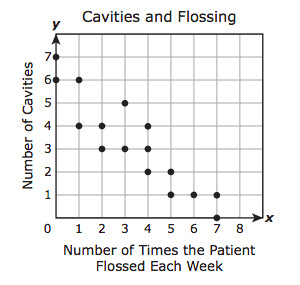
A dentist made the scatterplot below to show the number of cavities her patients had as it relates to the number of times they flossed their teeth each week. Which of the following best describes the correlation for the data?
1
45 sec
A.2.D: Direct Variation
Q.
2
60 sec
A.2.D: Direct Variation
Q.
A teacher collected data on 20 students for two different quizzes. The scatterplot below shows the relationship between the number of points scored on Quiz 1 and the number of points scored on Quiz 2. Which statement describes the data?
3
60 sec
A.2.D: Direct Variation
Q.
The scatterplot shows the number of free throws that different basketball players attempted and the number that each player made. Based on the trend in the data, approximately how many free throws would a player be expected to make if he attempted 60 free throws?
4
60 sec
A.2.D: Direct Variation
Q.
5
60 sec
A.2.D: Direct Variation
Q.
The scatterplot shows the relationship between the distance that students traveled to get to school and the number of times those students were tardy during the school year. The principal of the school wants to use this information to help him determine if there is a correlation between distance traveled and the number of times tardy. Which statement is a reasonable conclusion that the principal could make?
6
60 sec
A.2.D: Direct Variation
Q.
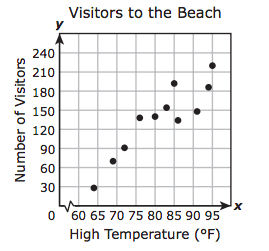
The scatterplot shows the number of visitors to a beach each day and the high temperature in degrees Fahrenheit for that day. Based on this scatterplot, which statement appears to be true?
7
45 sec
A.2.D: Direct Variation
Q.
The scatterplot below shows the relationship between the number of baseballs used in 14 games and the number of pitches thrown in these games.
Based on the scatterplot, what is the best prediction of the number of baseballs that will be used if 275 pitches are thrown?
8
60 sec
A.2.D: Direct Variation
Q.
In an electrical circuit, the voltage across a resistor is directly proportional to the current running through the resistor. If a current of 12 amps produces 480 volts across a resistor, how many volts would a current of 1.5 amps produce across an identical resistor?
9
60 sec
A.2.D: Direct Variation
Q.
The value of y is directly proportional to the value of x. If y = 35 when x = 140, what is the value of y when x = 70?