Loading...
Assessment#8 Mathematics 4
Quiz by Jaylord Arguelles
Tag the questions with any skills you have. Your dashboard will track each student's mastery of each skill.
It is used to compare data from different groups orperiods.
It is a collection of gathered information.
How many pupils answered museum as the best place?
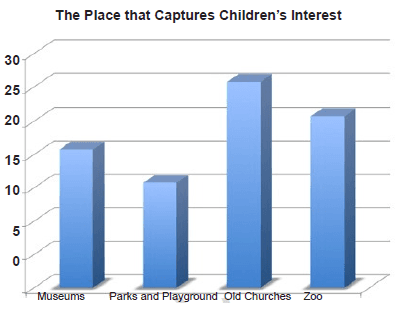
How many pupils prefer parks and playgrounds?
What places have the same number of preference?
What place was most preferred by children?
What place was least preferred by children?
What is the total number of pupils who joined the educational tour?
What is the title of the graph?

Most favorite color of student

How many students vote on blue?
Least favorite color
How many runs did Sarah have?
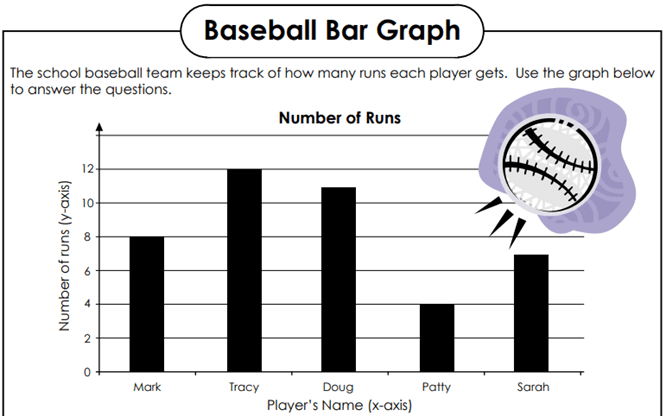
How many fewer runs did Mark have than Tracy?
How many runs did the player with most runs have?
How many more runs did Doug have than Sarah?
How many more runs did Tracy have than Patty?
Which type of TV set is more popular?
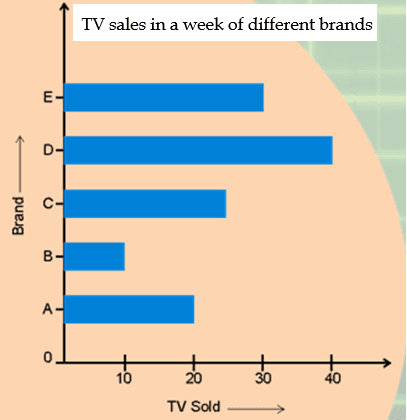
Which type of TV set is more popular?
How many TV sets did Brand A sold