Tag the questions with any skills you have. Your dashboard will track each student's mastery of each skill.
Give this quiz to my class
Q 1/12
Score 0
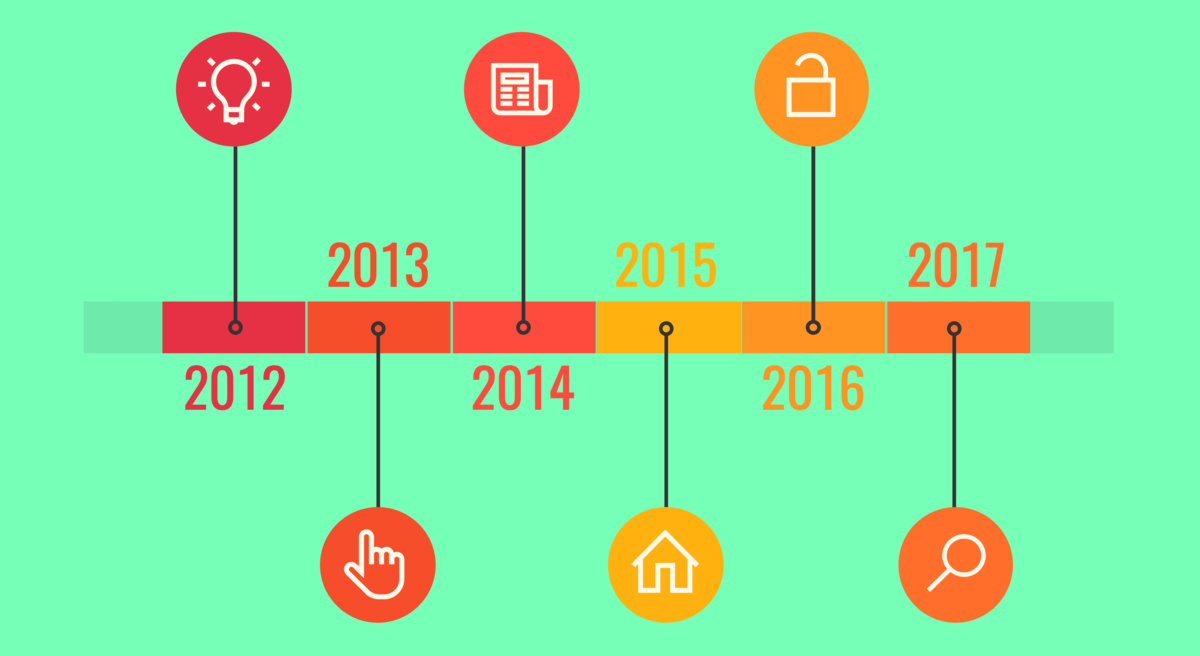
What is this called?
30
timeline
pie chart
bar chart
infographic
Q 2/12
Score 0
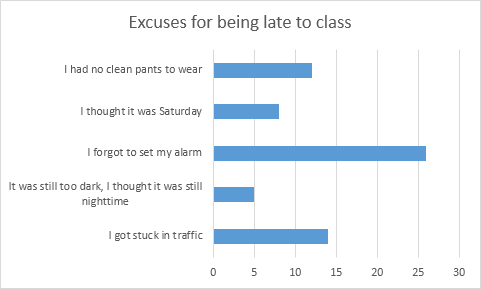
What is this called?
30
pie chart
line chart
bar chart
timeline
12 questions
Q.
What is this called?
1
30 sec
Q.
What is this called?
2
30 sec
Q.
What is this called?
3
30 sec
Q.
What is this called?
4
30 sec
Q.
What is this called
5
30 sec
Q.
Ms. Dearmin has asked you to show the events leading up to World War 2 but she doesn't want you to write a paragraph about it. Which of the following would be the best way to show the information she is asking for?
6
30 sec
Q.
Ms. Dearmin has asked you to show the gender breakdown for your class (how many students identify as a girl, a boy, or transgender). Which of the following would be the best way to show her that information?
7
30 sec
Q.
Ms. Dearmin has asked you to show how the Black Death impacted the population in Europe in 1346-1353. Which of the following would be the best way to show that information?
8
30 sec
Q.
Ms. Dearmin has asked you to do research about women's suffrage (women getting the right to vote). She wants you to include any facts or content that you think is cool and interesting. What would be the best way to show that information?
9
30 sec
Q.
Ms. Dearmin has asked you to chart the price of a loaf of bread before, during, and after the Great Depression. Which of the following is the best way to show that information?
10
30 sec
Q.
What type of information is probably shown in the image above?
11
30 sec
Q.
What type of information is probably shown in the image above?