Loading...
CR MC - A.3B Rate of Change
Quiz by Valary Patterson
Track each student's skills and progress in your Mastery dashboards
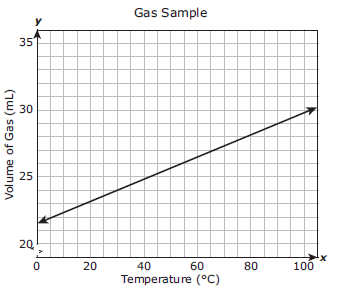
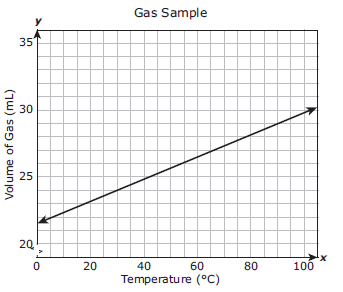
The graph shows how the volume of a gas sample changes as the temperature changes and the pressure remains constant. Which of these best represents the rate of change in the volume of the gas sample with respect to the temperature?
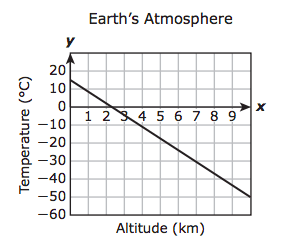
The graph models the linear relationship between the temperature of Earth’s atmosphere and the altitude above sea level. Which of these best represents the rate of change of the temperature with respect to altitude?
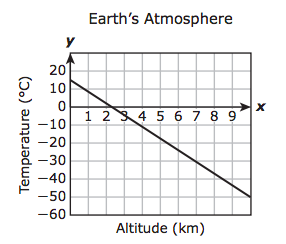
-0.29°C/km
-6.5°C/km
-0.15°C/km
-3.5°C/km
The graph shows how the volume of a gas sample changes as the temperature changes and the pressure remains constant. Which of these best represents the rate of change in the volume of the gas sample with respect to the temperature?
The graph models the linear relationship between the temperature of Earth’s atmosphere and the altitude above sea level. Which of these best represents the rate of change of the temperature with respect to altitude?
The function y = 3.75 + 1.5(x - 1) can be used to determine the cost in dollars for a taxi ride of x miles. What is the rate of change of the cost in dollars with respect to the number of miles?
The table shows the linear relationship between the balance of a student's savings account and the number of weeks he has been saving. Based on the table, what was the rate of change of the balance of the student's savings account in dollars and cents per week?
